A Visual Guide to the Financial Crisis
Monday, November 17, 2008 at 6:31AM
Randy in budget, connections, flowchart, money, spending, wealth
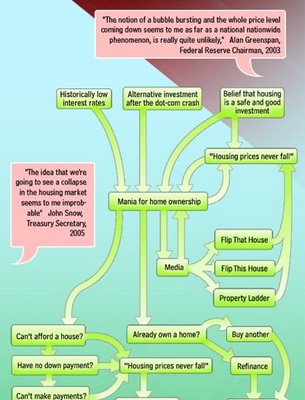
This is a tall flow chart helping describe the financial crisis, from
blog.mint.com.
Thanks Alwyn!
Article originally appeared on Cool Infographics (http://coolinfographics.squarespace.com/).
See website for complete article licensing information.