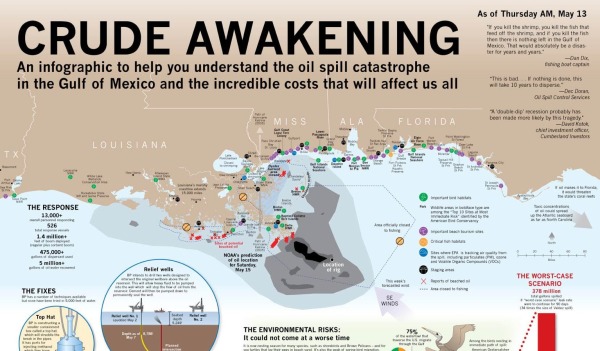
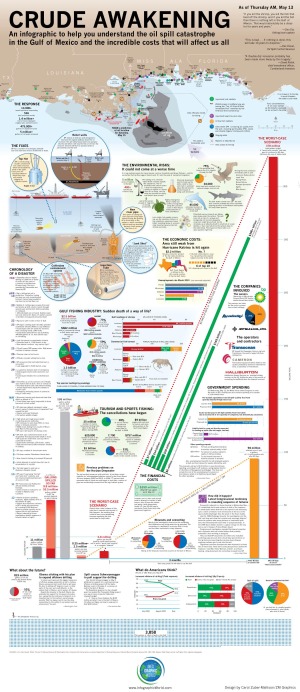
This is a very comprehensive, detail-heavy infographic designed by Carol Zuber-Mallison at ZM Graphics for InfographicsWorld.com. Including map data, a timeline, a few pie and bar charts, a schematic of the different fix scenarios and a visual of almost 4,000 squares.
“I usually do print work; this is my first piece specifically for social media. It just kept getting bigger and bigger as things continued to get worse in the Gulf.
I built it in four frantic days. There’s some things O would have done differently but when you’re working that fast you’re just putting stuff together with prayer and duct tape. Design takes a back seat to trying to get the information right.
This is an ongoing news event so things are constantly changing and I hope to update it at least once a week. (If you’ve found an error, please e-mail me so I can fix it.)”
— Carol Zuber-Mallison
Thanks to Justin Beegel from InfographicsWord.com for sending in the link!

