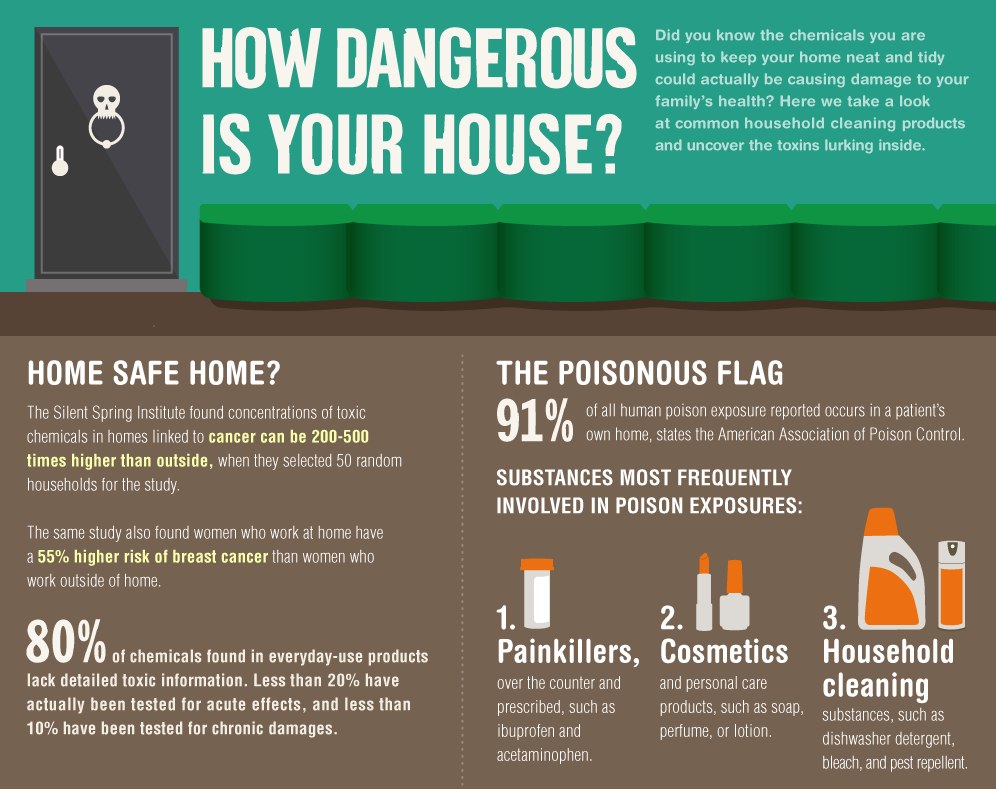
How Dangerous Is Your House? is a new infographic from Ecomom.com, and designed by Column Five Media. I love the content in this one! In fact it reminded me to talk with my son about some of these, however, the overall design has WAY too much text. Most readers will skim or skip over most of the text explanations. Why aren’t the statisitics visualized?
Thanks to Jarred for sending in the link!

