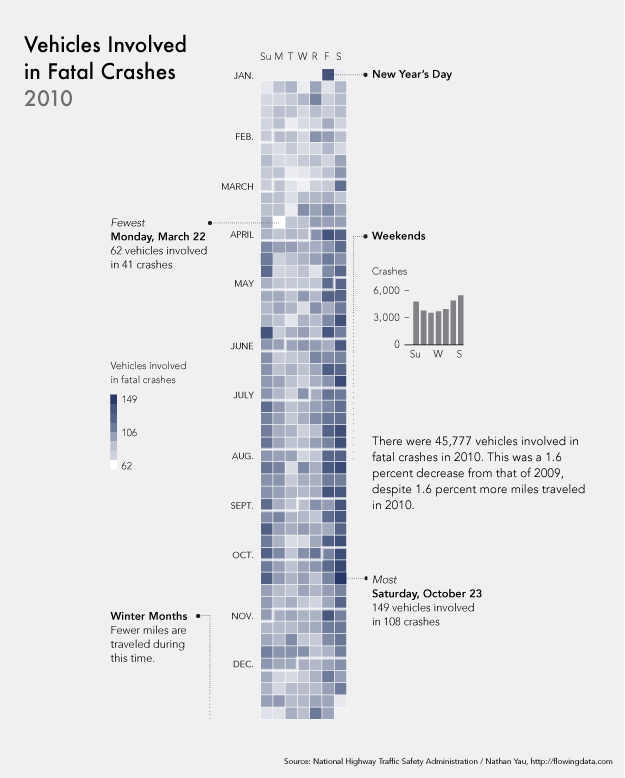
I really like this data visualization from Nathan Yau at FlowingData.com. Vehicles Involved in Fatal Crashes 2010 takes a new look at the statistics released by the U.S. National Highway Traffic Safety Administration. Instead of plotting them on a traditional map, Nathan looked at the time data.
After seeing this map on The Guardian, I was curious about what other data was available from the National Highway Traffic Safety Association. It turns out there’s a lot and it’s relatively easy to access via FTP. What’s most surprising is that it’s detailed and fairly complete, with columns for weather, number of people involved, date and time of accidents, and a lot more.
The above shows vehicles involved in fatal crashes in 2010 (which is different from number of crashes or number of fatalities). This data was just released last month, at the end of 2011 oddly enough. It’s a calendar view with months stacked on top of one another and darker days indicate more vehicles involved.
- Nathan Yau
As was suggested by others in the comments on FlowingData, I agree that since the weekends have the higher incidence rate, starting the week with Monday and moving Sunday to the last column may show that a little bit clearer.
Nathan has made all of the data avaialble for anyone that would like to try a visualization themselves. Student project?
