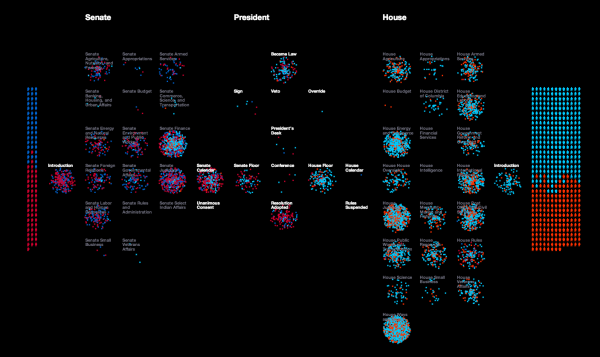
Legislative Explorer is an interactive, animated data visualization that visualizes the process of bills submitted by houses of Congress; the Senate on the left and the House of Representatives on the right. Designed by Researchers at the University of Washington’s Center for American Politics and Public Policy, it’s a fascinating visualization that is mesmerizing to watch.
A deluge of data is challenging scientific researchers across disciplines to develop new techniques for detecting patterns in large and complex datasets. This general area of research is known as data-driven discovery, or ‘D3.’ Visualizations are a particularly important area of innovation because they help researchers to investigate complex processes at a more holistic level. The goal of Legislative Explorer is to leverage the same benefits of data-driven visualizations to advance understanding of government.
A more in-depth discussion of Legislative Explorer with multiple animations and videos is available at the Center for American Politics and Public Policy.
Anyone can use Legislative Explorer to observe large scale patterns and trends in congressional lawmaking without advanced methodological training. In addition, anyone can dive deeper into the data to further explore a pattern they’ve detected, to learn about the activities of an individual lawmaker, or to follow the progress of a specific bill. Start Exploring!
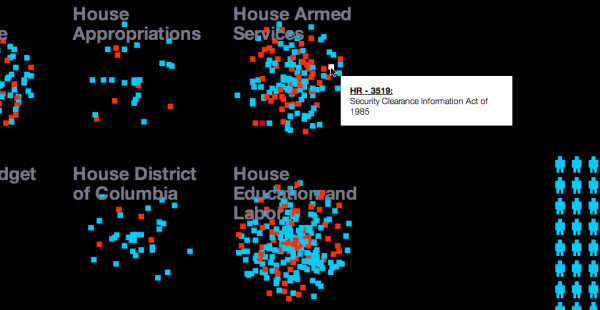
I selected the 99th Congress (1985-1986) for the screenshots, and you can see the party breakdown of both houses of Congress by their color. Each icon represents a specific member of Congress which you can identify by hovering your mouse over the icon. The animation will show a visual spray of bills introduced by members in both houses of Congress as party-color-coded dots that move into committees and through the steps to becoming a law.
There are a number of user-definable filters to help narrow down the visualization to a specific party, only one committee, or even just to watching a single bill move through the proces.
Here’s a quick video tutorial:
Found on FlowingData

