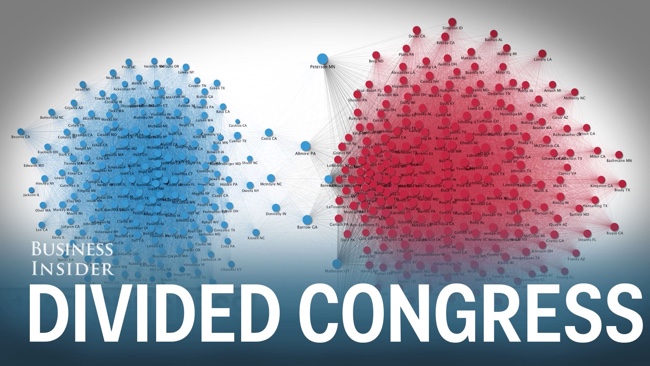
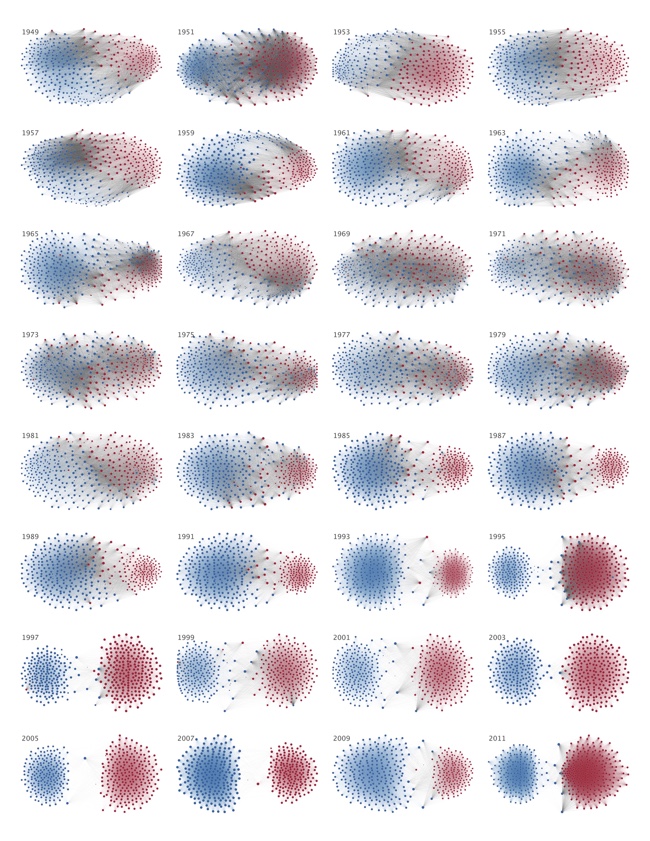
The Rise of Partisanship in the House of Representatives is a video infographic showing network maps and animating their change over time. Business Insider published this great data visualization video earlier this year.
This 60-second animation shows how divided Congress has become over the last 60 years
It's news to no one that Congress has had a hard time passing legislation in recent years. Some have even asserted that partisanship in Washington has reached historic levels. But how do we put the current divide in perspective? A group of researchers recently tried to quantify and visualize House partisanship in a paper published in PLoS ONE.
Produced by Alex Kuzoian. Original visualization by Mauro Martino.
To understand what is being displayed:
- Each dot represents a member of the U.S. House of Representatives
- Connection lines represent when two members voted the same way
- Connection line thickness represents how often they voted together during each 2-year period
- Dot size based on the total number of connections
- Color represents political party
A poster version of this design is also available on Mauro Martino's site:
Thanks to Sue Miller for sharing on Facebook!

