About
Randy Krum
President of InfoNewt.
Data Visualization and Infographic Design

Infographic Design

Infographics Design | Presentations
Consulting | Data Visualizations

DFW DataViz Meetup

Join the DFW Data Visualization and Infographics Meetup Group if you're in the Dallas/Fort Worth area!

Search the Cool Infographics site

Custom Search

Subscriptions:


Feedburner

The Cool Infographics® Gallery:

How to add the
Cool Infographics button to your:

Cool Infographics iOS icon

- iPhone
- iPad
- iPod Touch


Read on Flipboard for iPad and iPhone

Featured in the Tech & Science category

Flipboard icon

Twitter Feed
From the Bookstore

Caffeine Poster

The Caffeine Poster infographic

« Elon Musk's Resume of Failures | Main | Evolution of the Game Console »
Friday
May052017

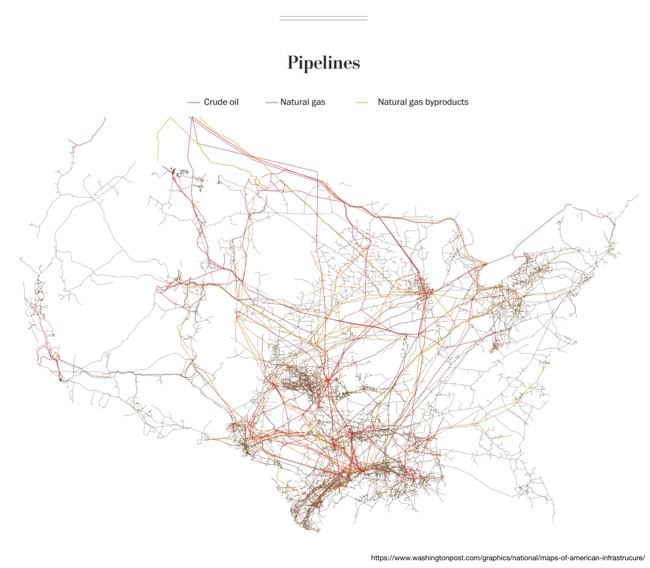
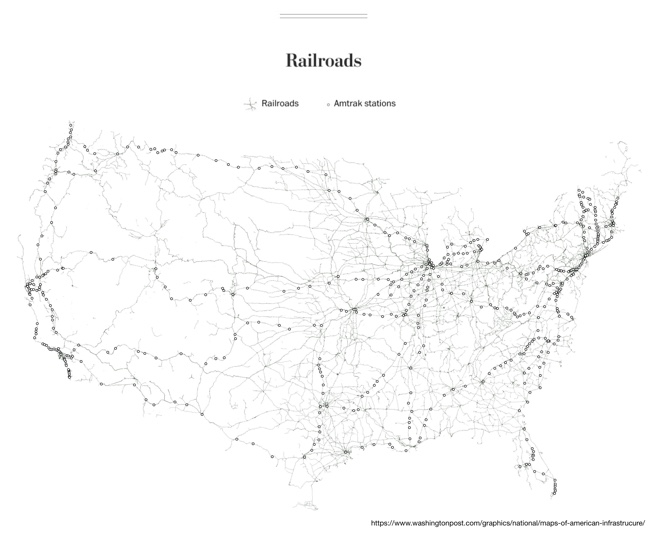
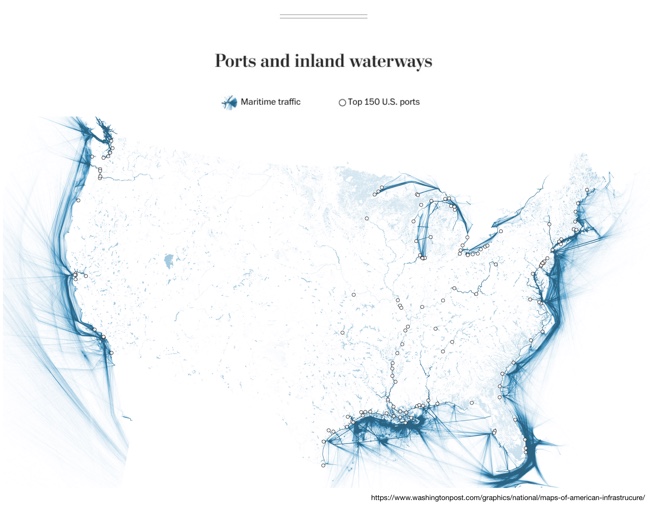
Six Maps that Show America’s Infrastructure

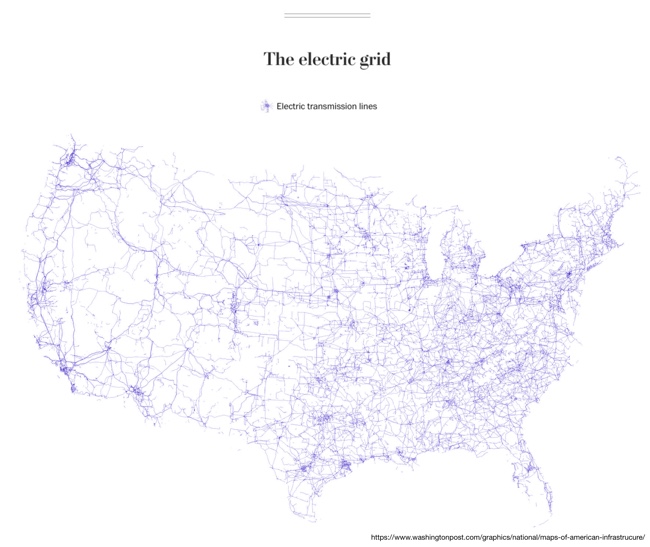
Tim Meko, a graphic reported at the Washington Post, designs some fantastic data visualizations. Six Maps that Show the Anatomy of America’s Vast Infrastructure is a great visual exploration of what makes America run. Check out the original article for more explanation of each map and more visual details.

Found on FlowingData

PrintView Printer Friendly Version

EmailEmail Article to Friend

Reader Comments (1)

this is nice website..
Editor Permission Required
While we are migrating to a new site design, you must have editing permission for this entry in order to post comments.