About
Randy Krum
President of InfoNewt.
Data Visualization and Infographic Design

Infographic Design

Infographics Design | Presentations
Consulting | Data Visualizations

DFW DataViz Meetup

Join the DFW Data Visualization and Infographics Meetup Group if you're in the Dallas/Fort Worth area!

Search the Cool Infographics site

Custom Search

Subscriptions:


Feedburner

The Cool Infographics® Gallery:

How to add the
Cool Infographics button to your:

Cool Infographics iOS icon

- iPhone
- iPad
- iPod Touch


Read on Flipboard for iPad and iPhone

Featured in the Tech & Science category

Flipboard icon

Twitter Feed
From the Bookstore

Caffeine Poster

The Caffeine Poster infographic

Entries in design (479)

Monday
Jul122010

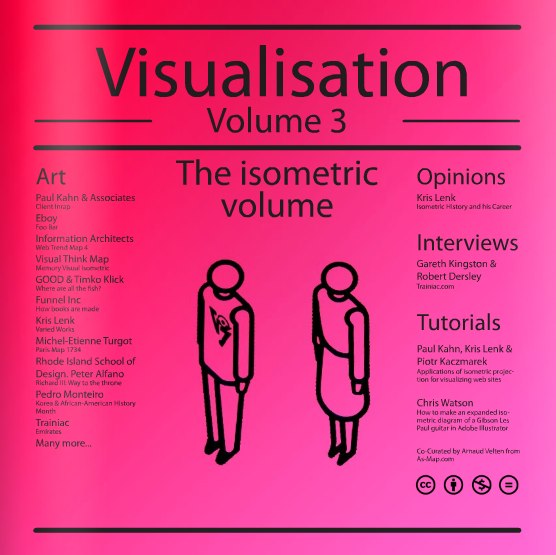
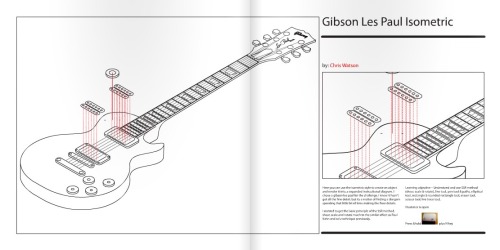
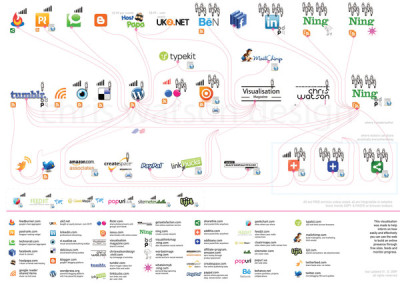
VisMag Volume 3: Isometric and an Interview with Chris Watson #vismag3


Chris Watson, from Visual Think Map,  has released Visualisation Magazine Volume 3: Isometrics.  You can view it completely online, OR you can purchase a print copy from Amazon.com for $22.00.  This volume covers some of the great designers of isometric-style infographics that have been published in both print and online.

You can win a FREE copy of the printed book by tweeting a link to this post on Twitter using the hashtag “#vismag3” by the end of the day on July 16th.  A winner will be randomly chosen to receive a printed copy of the book.

Chris was very gracious, and has also agreed to answer a number of interview questions about his work and publishing Visualisation Magazine:


Cool Infographics: How often do you publish the volumes of Visualisation Magazine, and how many in the future do you already have the topic planned?

Chris Watson: I’d like the volumes to be more regular in their publication, and hopefully more consistent, but I got delayed with this one as I had other things taking my time. Greg Smith at serialconsign.com said to me in an email ”Nothing is ever definite (datewise) when it comes to publishing, web or otherwise”.

Yes, I have some future volumes planned.  The next issue was going to be a collaboration with Wes Grubbs at Pitch Interactive, but recently he has had to concentrate on work recently. We still have a potential list of contributors and work lined up to contact, including Greg for: Volume 5 | Large Data Visualisation: Form and Process

So, due to the delay, and wanting to keep it moving along, Logan Holmes, a colleague of mine, at the same college where I teach and just as passionate an admirer of infographics, suggested we do a volume on the less clinical, beautiful, finished, polished examples of data vis/infographics. Therefore, we thought let’s show the handmade, in-progress examples with less formal styles. They might be just humorous, making good observations of life, or challenging our visual thinking. http://visualisationmagazine.com/volume4_handmade.htm

The list is still being compiled and as yet no one is confirmed, but hopefully we can get permission for most of what we have seen. 


Cool Infographics: How long does it take to put together an issue of Visualisation Magazine like The Isometric Volume?

Chris Watson: It probably takes 2 weeks to put together when you have all the content. Allowing time to not see it for about a week and then come back to it so you can see your typo’s and be more judgemental as to its overall look, order etc.

But as I do it as a ‘hobby’, meaning to say it doesn’t pay me like my teaching job does.  I have to balance how many evenings I spend compiling, sourcing high-resolution files, rendering to the right file format for printers, etc. with how much time I spend with my partner.  Overall, it ends up taking about 2 months, 10-12 weeks.


Cool Infographics: What are your thoughts behind selling the printed version, but making a complete online version available for free?

Chris Watson: It’s intriguing you ask that.  My initial motivation to make the magazine was that I wanted a publication that was just on infographics and data vis because it is such a growing field with so many being produced. There are written journals such as IEEE with their vis week and there are conferences such as VizThink, but where is the style side?

You have one for typography – Eye, graphic design/advertising – Creative Review, illustration – Computer Arts and then their sister publication – Computer Arts Projects that varied their specialised content.

I would have loved to have printed it from the start, but just assumed you’d have to buy a bulk amount of copies. I thought I’d see if it got a following and then one day ask if they would buy, or invest in printing. Then, after circles with Pedro’s help we got lots of positive praise with thanks to you Randy for helping raise awareness on blogs.  Many of them asked ‘is there any chance of getting it printed?’.

One of them pointed out that there was a Print-on-demand service called Magcloud in the US through LinkedIn. Shame they didn’t ship over the pond (back then, I haven’t checked since). Anyhow researched about print-on-demand, and developed a visual comparison here http://visualisationmagazine.com/blogvisualthinkmap/2009/10/self-publishing-visualisation.html

So I could make it available to print through Create Space and cost me a proof copy, not a bulk batch that I had to try and sell and hope there was a demand for it.

I left it free to view online because it was my original intention.  It’s just great to see the work in print. I think Nathan at flowingdata.com about the same time started a print facility of just the posters, as apposed to a bound book.

I’d like a publisher to get behind it, market it, and print it bigger, as probably does anyone ;o).


Cool Infographics: What tools do you use to design and layout a volume.

Chris Watson: I use Adobe InDesign, Pedro was familiar with InDesign and I had trained with InDesign at college and being Adobe, the interface is familiar to Illustrator and Photoshop. I did the 1st volume/version on Adobe InDesign 2.0 and it has improved a lot to the CS4 version that it is rendered through now.

Photoshop renders the pictures and Create Space desires you to render your cover (front and back glossy outer cover) through it.  Their template for trim sizes is in .psd format.

The style of the layout and design was influenced by NeueGrafik and the swiss/basel school of design with J M Brockmann etc. that both Pedro and I loved. Clean white space and Helvetica font to not interfere with the infographics/data vis work.


Cool Infographics: How receptive were the different designers to being included and giving you the information you needed?

Chris Watson: Oh, they are the reason it works.  If they didn’t get back to me, I’d have no content. I don’t just want to feature them without permission and many instances I’d like higher resolution files for good quality prints. So huge thanks to everyone who contributes and responds back to my emails.

They are all generally very happy to feature their work. I don’t share their high res files with anyone other than the printers in a PDF, and you get some that go to above and beyond what I’d asked for to give me more content.

For instance, Arnaud from as-map.com on the last issue said, you should look and feature Paul Kahn’s work. Paul shared the passion for the magazine and sent me examples of his work (…& Associates), and a few images from a journal article that had been published. Then he mentioned I should look at Kris Lenk and speak to him about his work, as they both had created dynamic diagrams.

I contacted Kris and he sent me an article, images, work from his students at Rhode Island school of design. Same with Gareth at Trainiac.  He sent me loads, chased down copyrights, answered an interview sharing great insights and got Rob, a designer/colleague to answer them as well.

So they are all very generous with their time, and work, which I’m very thankful for and I guess it gives them and their business/work further exposure, kudos.

Many of them only ask that I clearly point out the owners/authors, offset one or two images not to show the entire image of their work because they also sell it commercially.  Some ask if I can send them a printed copy, which I’m trying to do with the slight amount of profit it makes. Needs to sell more to be able to order copies to be sent to people, as I don’t have any capital, just an abundance of time, enthusiasm and effort.


Cool Infographics: Was it difficult to coordinate the different Copyright and Creative Commons issues?

Chris Watson: Yes, to an extent.  I recently got a template for a printed written agreement form to send to people to try and safeguard against legal action and I hope it never arises.  I wouldn’t share or feature it without an email saying ‘yes ok’. The Circles and this Isometrics volumes were just people saying ‘yes, sure’.

To enable the online smooth nature of communication between me and the contributors, I found a fax to email site that people send to.  I get it as a PDF file so they could sign. The agreement slows the process down, and people worry about what they are signing. So still not sure if I will use it, I have an email with them saying ‘yes use it’.

Not sure I have seen any instances of how the creative commons has stood up in court. Not with sites like Flickr.com and Behance.net integrating it to license their work with a ‘I trust it if they do’ sort of attitude. They are good because I want to share it, non-commercial, attributed to the author.


Cool Infographics: Where do you have them printed, what are the printing specs and why?

Chris Watson: After comparing in the link from question 5, I use Create Space, setup by Amazon. Let everyone anywhere order a copy.

They have, like many of the others, preset sizes, and I assume they have costed it that way.  But I wanted the square format; I liked the other magazines previously mentioned such as Computer Arts Project and Creative Review. It’s sort of balanced and proportioned, much in the vein of NeueGrafik and a slightly cheaper end price for the buyer compared to A4 (less paper, less ink used I guess).

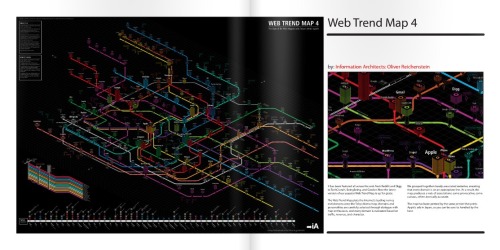
This square was 8.25 x 8.25 in their presets so had to tweak slightly to what I had original made for online.  I think I did 10 x 10 (inch). It took a bit of farcing trying to interpret their specs for dimensions with margins and bleed areas. Maybe it’s just me, but I eventually realised where they wanted the margins and bleed space and thankfully it didn’t make it smaller by too much. I have a template now, so didn’t take as long for the Isometric Volume. I sacrificed a little of the white page space from around the designs, the edge of the page to the edge of a box, bold line/title. But overall, I was extremely pleased with the binding, cutting and colours printed (I struggled mind you with dense black areas such as Web Trend Map or the Oscars visual by Wes,  It was hard to see the colour details).


Cool Infographics: How has the Issuu service to publish online worked for you?

Chris Watson: I liked it.  I need to figure out how to get the Flash used by Issuu.com to display on an iPad and smart phones. I think you can wrap it in HTML5 in some way.  I’ve seen a nice infographic I tumbled and need to investigate further.

You can get an app for Google Android to view publications as opposed to directly on my site, and I think they are making one for iPhone.

It’s good because I could customise it to remove certain functions from the interface such as downloading the PDF, embedding the whole document at their own site rather them view it at my site and hopefully subscribe to the mailing list to see future/previous issues.

It has this nice zoom capability, which at the beginning was good.  I’d like you to be able to zoom into visualisations that were really large and detailed such as the Web Trend Map and density designs work. It also let people share it through the Sharethis service or email to try to get the web 2.0 going and raise awareness of the publication.


Cool Infographics: What’s your favorite Isometric visualization?

Chris Watson: *smile* I’m not sure, its partly the reason I put them in a mag. There are various aspects of all the different ones featured.

For instance I love the abstract creative nature of Eboy.  It’s a very graphic design (I trained and teach graphic design). They might not communicate specific info with a clear message or comparison like an infographic, but I love the visualisation of the websites into abstract non-physical (i.e. the world wide web/digital) space. Like the Web Trend Map, it takes the Internet from a conceptual space to an impression of absolute almost physical space.

The width dimension with the stacks for stability in the Web Trend Map is so good.

Love the idea of files been given a space in the same way like with Paul Kahn’s work, that you can navigate and see them as a whole in your computer (…for them a website).

Love the physical space being depicted in a flow of processes with Funnel, Inc., and the complexity that Trainiac depicts and abstracts different departments in a business. The bold colors in a line graph with GOOD, inc. and Timko & Klick; very unique.

Arnuad’s CV style is brilliant too.  With the color-coding of how the skills have built up to be him as they stack in the middle.

Bit of an evasion to the question, but I do love these different successes.


Cool Infographics: What can we expect from Chris Watson and VisualThinkMap in the future?

Chris Watson: Hmm…  Busy, I might be sad but I keep trying to challenge how I visualise data, or visualise things that I think would greatly benefit. It’s strange but for a designer they are always striving to create new forms/reinvent old forms, create the new. It’s what drives me, so I try to make new forms, not just stylistically but that have function too.

I did a wayfinding project for a library at a college. Ultimately, they didn’t use it as I designed.  I didn’t really get asked to; I just wanted to make it better and spent longer than expected to make the design work for the place. It didn’t sit well with me as planned to let them use it for free.  I offered it to them really cheap but they didn’t want to pay.  It’s a shame, but you can’t blame them. Will post the look of that soon with some of the thinking behind the project.

I have recently completed this project that I need to get round to posting and telling the Wordpress community.  I want to see if they will use it, or consider it.

http://www.behance.net/gallery/My-Wordpress-Web-2_0/513412


I revamped the My Web 2.0 graphic as I have come across new services that I use since its inception.

http://www.behance.net/gallery/My-Web-2_0/379498


Working on the next issue with Logan Holmes of Visualisation Mag – Handmade/Informal – Volume 4 

I am collaborating with Logan on visualising poetry/creative writing with illustration/drawing and plan to make it into a bound book differently than that through Create Space. 

Logan, myself and another colleague (photographer) are planning projects that do blow our mind and hopefully are realised in the future.


Wednesday
Jul072010

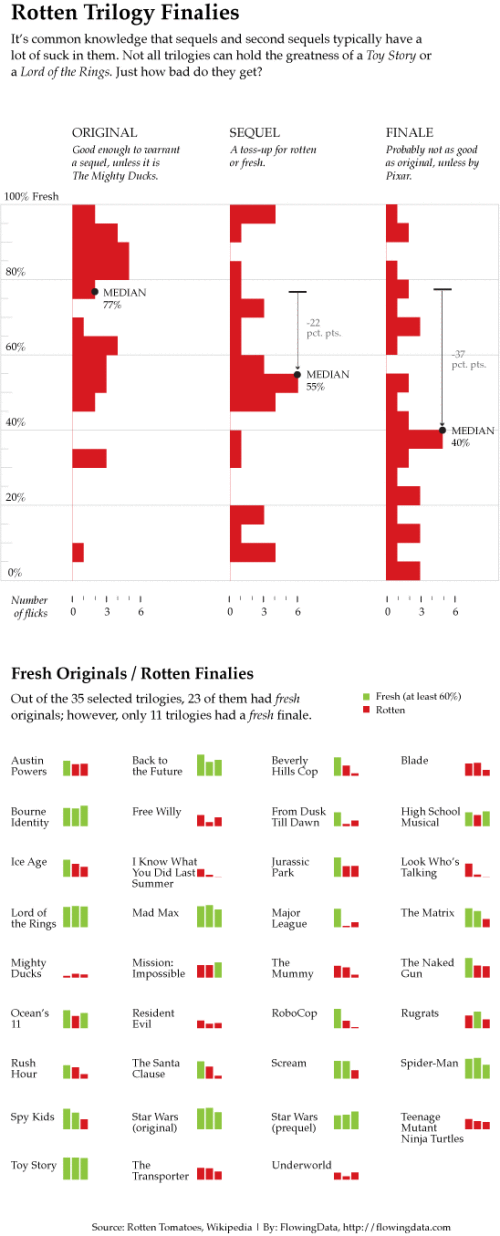
Rotten Movie Trilogies Comparison

Nathan Yau from Flowing Data Designed this new underload infographic: Movie Trilogy Comparison.

The third installment of Pixar’s Toy Story is making a killing at the box office (rightfully so, because it’s Pixar-tastic), but not all trilogies have the same luck. They can’t all be Lord of the Rings epics (all over 90% fresh), unfortunately.

Who knew Free Willy was a trilogy?!?


Monday
Jun212010

Where Americans are Moving (interactive infographic)

From Jon Bruner at Forbes.com, Where Americans are Moving is an interactive map infographic that shows the migration both into and out of that county.  You’re not limited to the predefined cities that have buttons, but can choose any county in the country.  Even after zooming in, it can be hard to see the details because there are so many lines displayed.

More than 10 million Americans moved from one county to another during 2008. The map below visualizes those moves. Click on any county to see comings and goings: black lines indicate net inward movement, red lines net outward movement.

Based on IRS data, I wish the statistics were easier to see.  You can get access to the underlying data at data.gov; search for ‘migration’.

Who knew so many people were moving out of Hawaii?!?

Found on ChartPorn.com, FlowingData.com, and @JonBruner

Friday
Jun182010

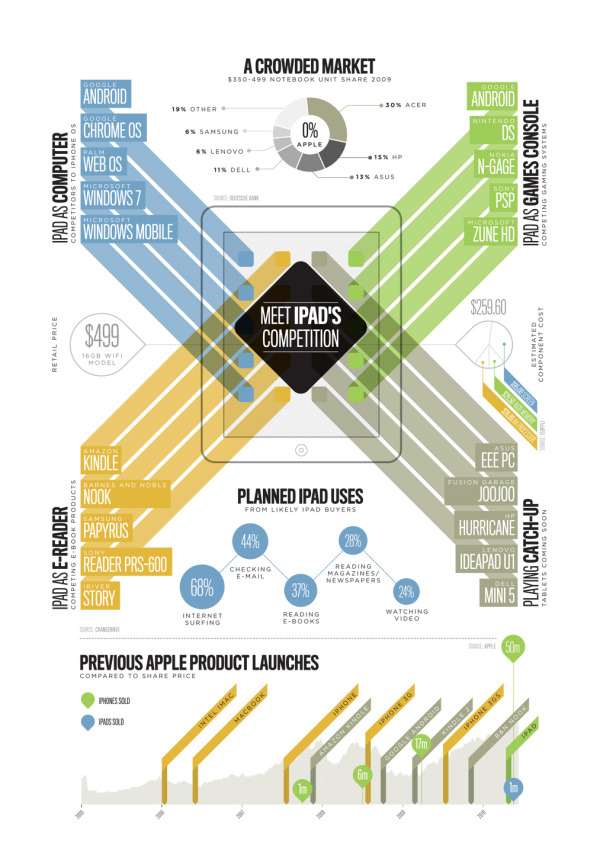
iPad Meets the Competition (infographic)

From SectionDesign, iPad Meets the Competition is great design that looks at the products in the market that will compete with the iPad in four different product categories.

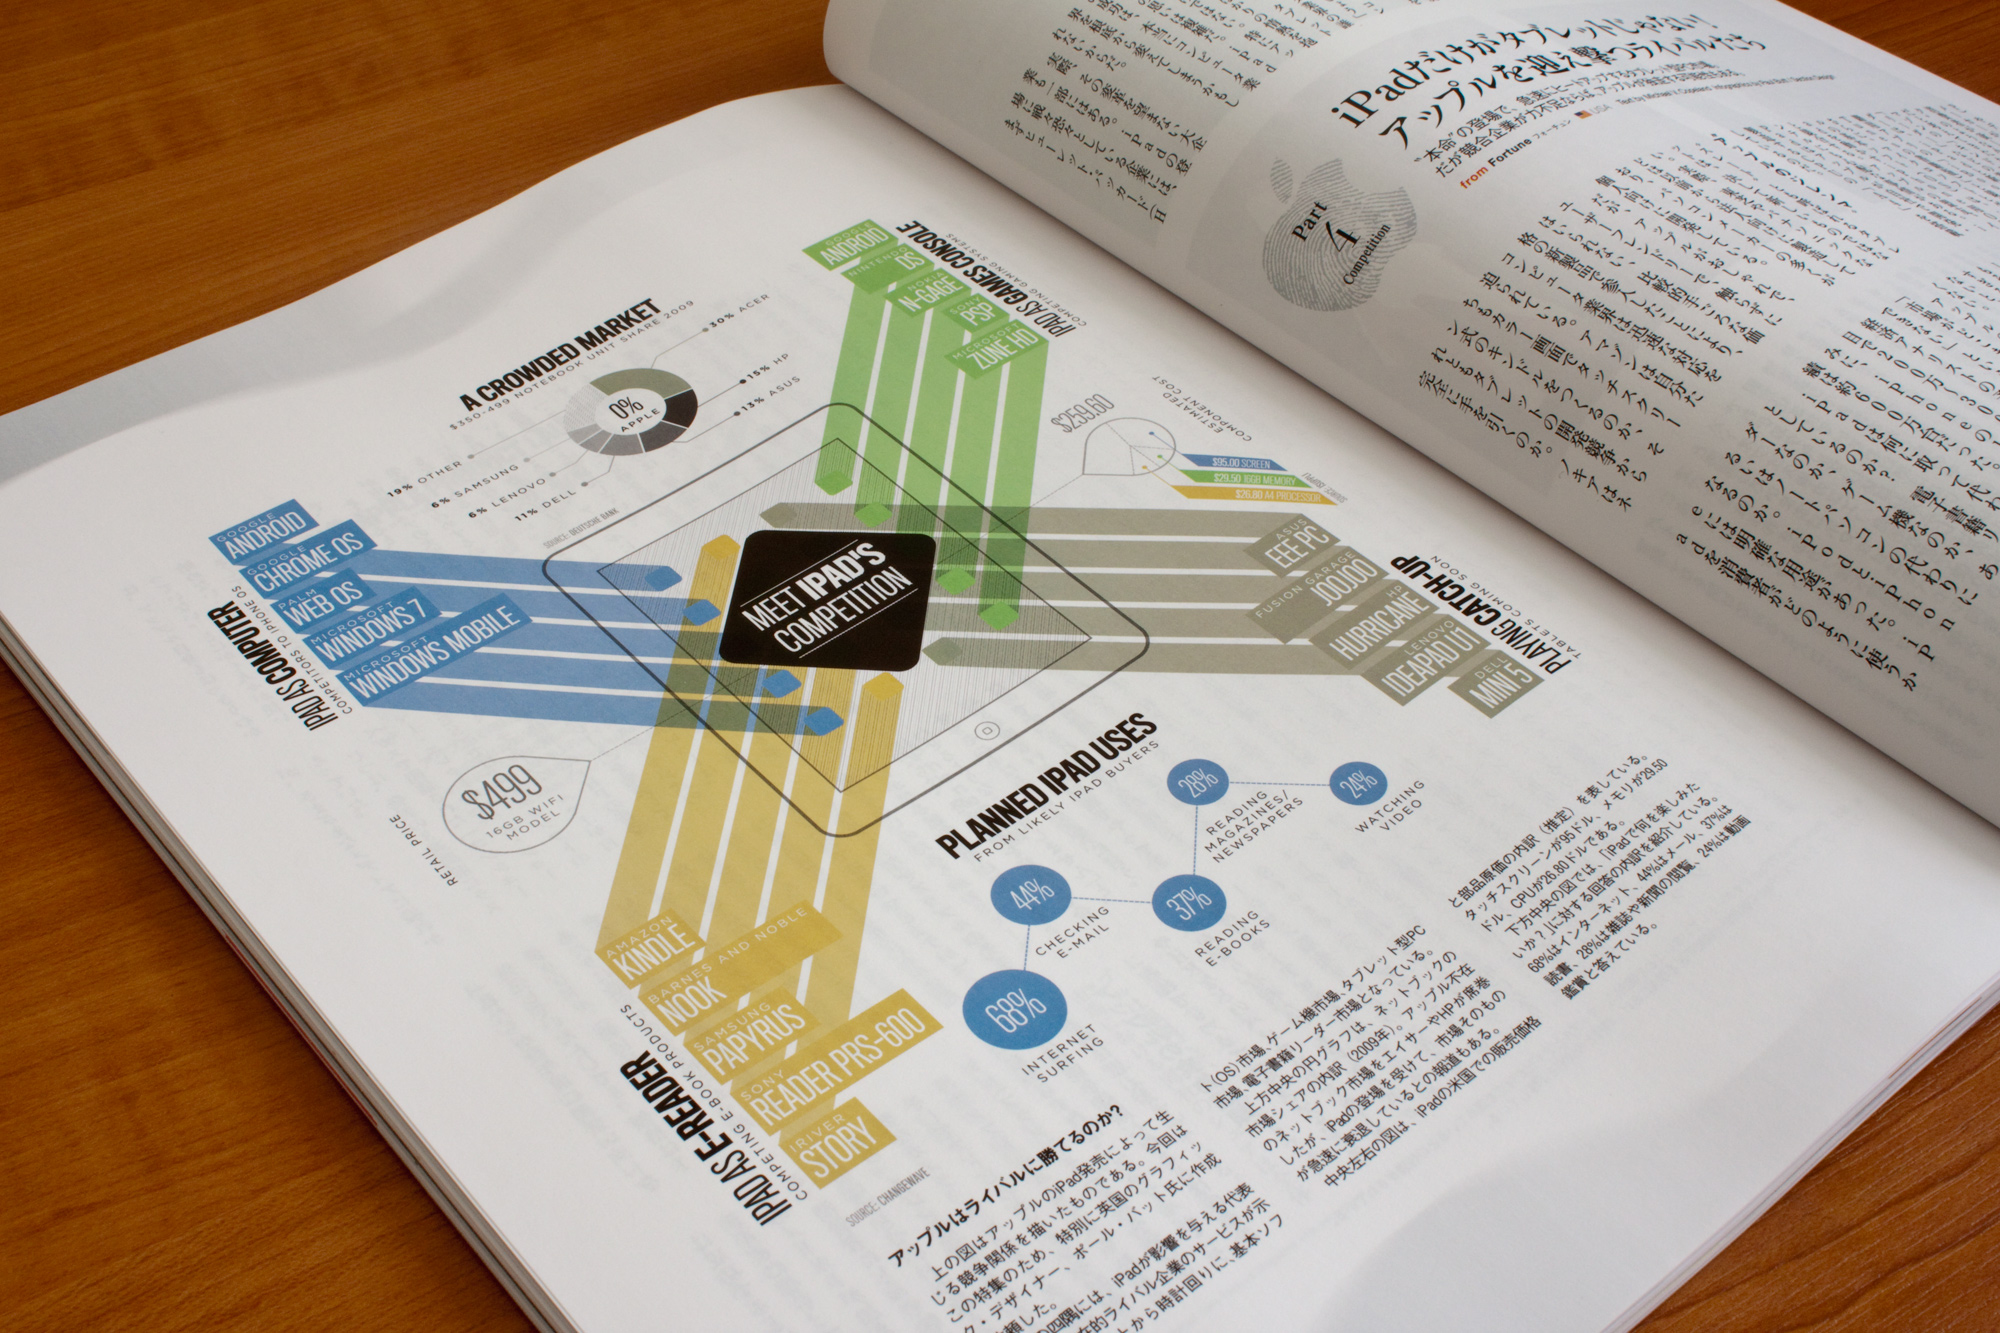
This infographic was commissioned by Courrier Japon Magazine in Tokyo and is based on the article “The iPad Changes Everything” originally published by Fortune Magazine. It was printed in the July 2010 Issue.

It illustrates the introduction of the iPad and how many devices in different markets are now finding themselves in direction competion to the power of the iPad and the Apps Store. All data was researched by myself, and the graphic was later split onto two pages to better fit the flow of the article.


Found on FlowingData.com

Wednesday
Jun162010

Facebook's Secret Strategy Infographic

Art: Audrey Fukuman

There was some controversy when Facebook CEO Mark Zuckerberg unintentionally revealed the 2010 Facebook Strategy Infographic that was printed on the inside liner of his hoodie at the D8 conference.  Audrey Fukuman at SFWeekly.com has recreated the infographic based on the video and photos.

Photo via AllThingsD/Anna Mathat

According to SFWeekly.com, this was a hoodie given to all Facebook employees.

I expect some disagreement, but I’m a firm believer that you can absolutely design an infographic to represent a strategy, a concept or a qualitative result.  Infographics don’t have to be based only on a massive amount of quantitative, numeric data.  What do you think, does this qualify as an infographic?

Here’s the video clip from the AllThingsD D8 conference when Mark removed the hoodie and revealed the graphic:

Found on SFWeekly.com and digg.com

Tuesday
Jun152010

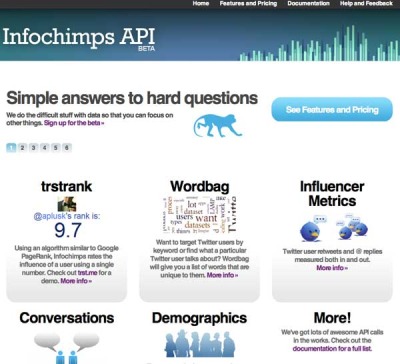
InfoChimps Data API BETA program launched!

InfoChimps.com has launched the BETA program for the use of their data through InfoChimps APIs.  The two initial data sets are Twitter and U.S. Census data.

Initial pricing has been announced for this introductory period, and there is a level for FREE access for anyone who want to experiment with the data.

Found on ReadWriteWeb

Friday
Jun112010

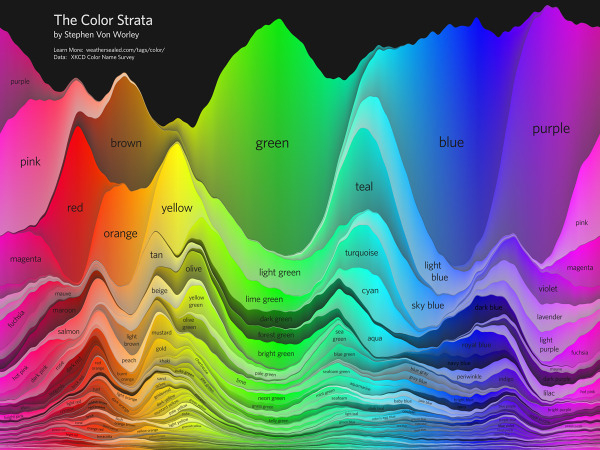
The Color Strata, a beautiful color naming infographic

Stephen Von Worley at WeatherSealed.com has taken the data made public from XKCD’s Color Name Survey and created a very cool infographic, The Color Strata.  Check out the high-resolution version.

The Color Strata includes the 200 most common color names (excluding black-white-grayish tones), organized by hue horizontally and relative usage vertically, stacked by overall popularity, shaded representatively, and labeled where possible.  Besides filtering spam, ignoring cruft, normalizing grey to gray, and correcting the most egregious misspellings (here’s looking at you, fuchsia), the results are otherwise unadulterated.  As such, similar color names, like sea green, seafoam green, and seafoam, each appear separately.  They’re synonymous… or are they?

Also check out the smoothed version:

It’s the same basic graph, but with flipped shading, label-free, stretched to fill the vertical, and whipped until creamy smooth.

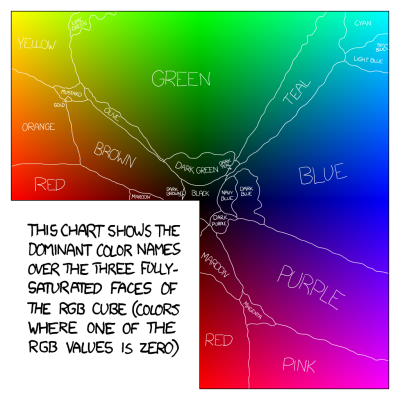
The volunteer survey have over 200,00 respondents that named over 5,000,000 color samples.  Here’s the original image created by XKCD.com when they posted the data.

Found on ChartPorn.org and FlowingData.com

Thursday
Jun102010

A Cool Interview with Nathaniel Pearlman (infographic designer)


With the release of the Visual History of the American Presidency last week, I asked Nathaniel Pearlman, infographic designer and President of Timeplots, LLC, if he would be willing to do a short interview.  Nathaniel was nice enough to answer a few questions about his infographic design process and his projects.

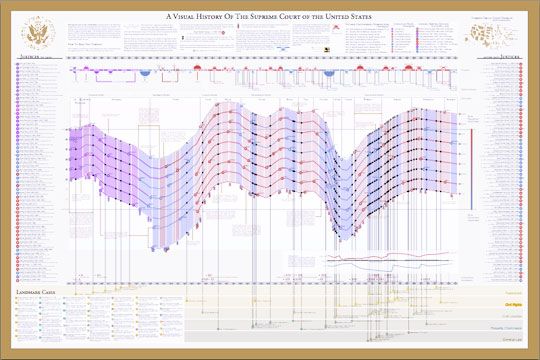
Nathaniel started the company in May 2009 and released the Visual History of the Supreme Court of the United States (SCOTUS) (which you see above) as their first infographic poster. 

Here’s the interview with Nathaniel:


Cool Infographics: What software applications do you use for the Timeplots posters?

Nathaniel Pearlman: So far we have programmed our graphics in the R language and done some final design work in Illustrator. I’m interested in hearing about other platforms to use for complex data and layout — especially other software applications that would allow us to create interactive and print versions from the same code base.


Cool Infographics: Can you describe your design process?

Nathaniel Pearlman: We start by asking ourselves what an informed audience would want to know about the subject we’re tackling. For example, for the presidential print, we asked ourselves, “Why is each president important? Why should people care about these guys? What is measurable about the context in which they served, and how could we show that?”

Then we go through a data collection phase: we take some time to see what data has already been collected on the subject, we catalog sources, and then we obtain data (and rights, if necessary) for the information we need. We wait until we have the hard data and have examined it and visualized it in several ways before we settle on what stories we can pull out of it.

The primary phase of the design process is iterative – there is a lot of trial and error. For example, we programmed (and scrapped) several major design ideas for our Senate print before settling on the current version. It turns out that our process is longer and more involved than I expected. Each print thus far has taken many months of data collection, design, and review. We also included quite a number of reviewers into our design process, folks with substantive expertise and designers as well.


Cool Infographics: What’s the most interesting thing you learned from the data?

Nathaniel Pearlman: I like the big picture: for me, the presidential print shows a historical view into the sweep of U.S. history — a marked contrast with the more journalistic, and immediate, take on the political and economic state of the nation that we are used to seeing in the news. It lengthened my perspective on current events, and I hope that it does so for those who purchase the print.

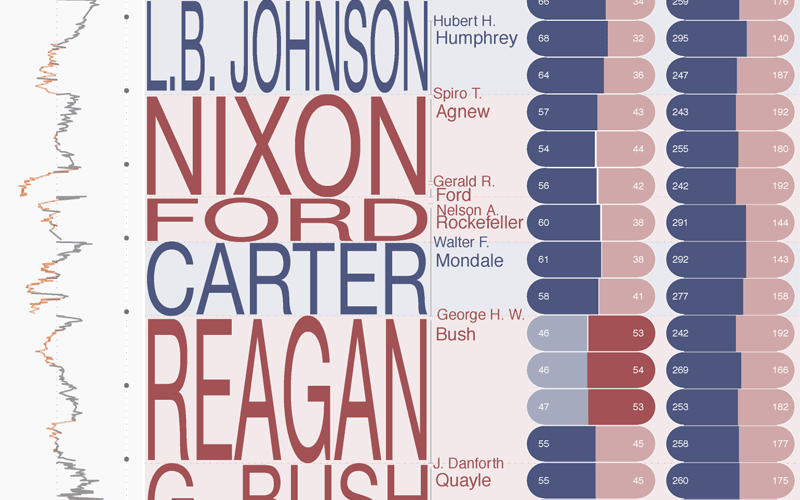
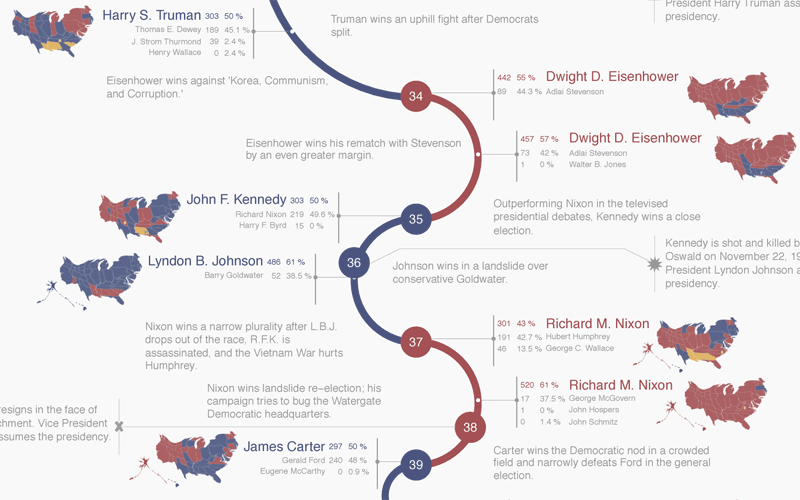
When you see the entire span of U.S. history visualized in just a few feet of space, you see the economy bouncing up and down, the parties jockeying back and forth, the budget bumping along. The ups and downs then seem fairly routine from this perspective, especially when compared to the sensationalism of our daily headlines. The other thing that really stands out is the growth of the country since 1789, both economically (in real GDP) and in population. As to the small picture: I love seeing details of each election — what percentage of the vote did Strom Thurmond get in 1948, for example, and which states did he win — so we tried to put each election into context with a scoreboard and electoral cartogram wrapped around the curve of party control of the executive.


Cool Infographics: What was the hardest part behind designing the Presidential poster?

Nathaniel Pearlman: When you see a finished product like ours, what you miss are the hundreds of decisions that were labored over as it was created. For me, the most difficult thing is deciding when I’m done. Every time I look at a new draft, I have ideas for changes that could be made. At some point I have to say “enough is enough; we are done.” The other hard part is writing the text that’s included on the print.. just crafting short explications of each presidency is difficult.


Cool Infographics: Where are some of your favorite places that have the SCOTUS poster on display?

Nathaniel Pearlman: We are happy that the U.S. Supreme Court library displays a framed print, and the gift shop in the Supreme Court building itself carries the print. We’ve also seen many purchases by legal luminaries — we’re not legal experts ourselves, so it’s nice to see that the experts appreciate our work. A son of a current justice bought one. Also, many high school teachers from across the country have purchased prints for their classrooms (we offer discounts for educators); it’s great to see teachers showing interest in using data visualization as an educational tool.


Cool Infographics: Where do you have the posters printed, what are the printing specs and why? 

Nathaniel Pearlman: We shopped around quite a bit for a printer, because we are fussy about the results – we wanted the quality of the paper to top-notch, we needed relatively fast turnaround and reliable fulfillment, and we wanted the printing process to be environmentally friendly — all of this, of course, at an affordable cost. We currently offset-print the posters in Maryland, at Whitmore printing, and they also do our fulfillment. (Ideally, we would like to find an affordable on-demand printer who can handle our large-scale posters and fulfillment. If we found this, we would be able to sell shorter-run prints; please send me any suggestions!)


Cool Infographics: Would you share some thoughts on running a business selling infographic posters?

Nathaniel Pearlman: I am enjoying Timeplots. As a profit-generating business, it is not for the faint-of-heart. I am lucky to have some time and space to try it, but it is unlikely to run in the black for quite some time. My first company, NGP Software, Inc. (www.ngpsoftware.com) is doing well and allows me to do this on the side.


Cool Infographics: How has the Timeplots On Demand side of the business been going with private clients? 

Nathaniel Pearlman: We’ve really enjoyed working with people who aren’t necessarily familiar with data visualization — everyone who we’ve worked with has been more than happy with the results. So — if anyone reading this has a project in mind, or if you want us to create a visualization for you or your institution — let us know!


Cool Infographics: How did the process of using Amazon Mechanical Turk for proofreading work for you?

Nathaniel Pearlman: Mechanical Turk is a good method for crowd-sourcing some kinds of work. We’ve used it for three separate projects now — twice for proofreading, and once for fact-checking research. We have gotten more hits than misses, so it’s been worthwhile. Eliza manages that process and has been impressed by the level of work she has received. The Mechanical Turk worker community (“turkers,” as they call themselves) are serious about their work, and it shows. In a couple cases, a “turker” found an error that we all missed: for example, when we posted the presidential print for proofreading, one turker pointed out that we listed Vice President John C. Breckinridge as “Breckenridge,” clearly misspelling his name. Another turker noted that we had described President Taylor as dying “halfway” through his term, when in fact it was a few months prior to “halfway.”


Cool Infographics: What should we expect in the future from Timeplots?

Nathaniel Pearlman: We have a rough list of fifty or sixty more projects we would love to do. After we launch the Senate print, we will decide what is next. I would love to hear from your audience what they would like to see, and we are always looking for collaborators, if someone would like to work with us on a project that they care about. We’re always open to new ideas!


Thursday
Jun102010

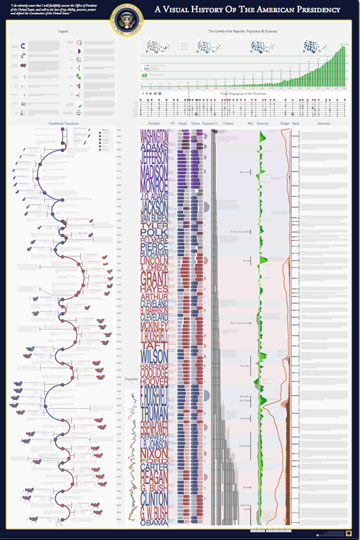
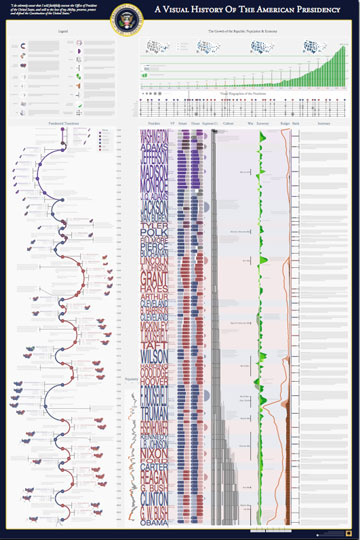
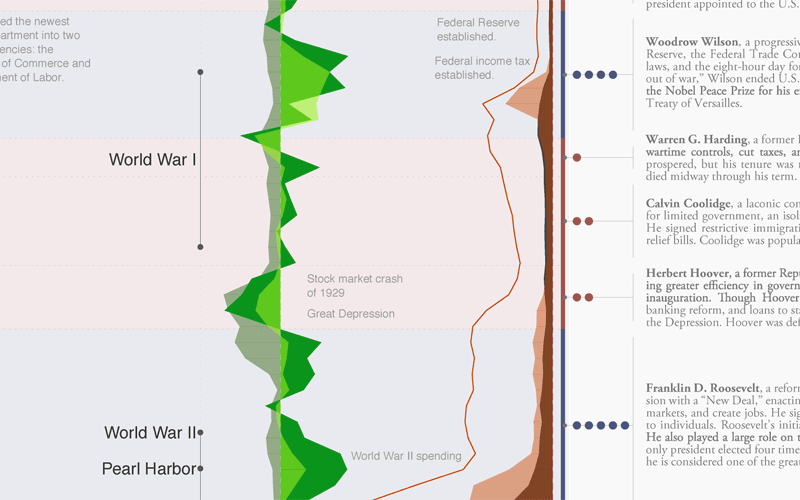
A Visual History of the American Presidency - new infographic poster


Timeplots has released their second infographic poster, A Visual History of the American Presidency.  Timeplots was launched by Nathaniel Pearlman and Frank Hamilton in December 2009 with the release of the Visual History of the Supreme Court infographic poster, which is now hanging in many schools, law practices and political offices.

This large-scale print is like nothing else available on the history of the American presidency. It places each president in historical context, visualizing a remarkable range of political, social, and economic measures to succinctly tell the story of the presidency. Narratives are displayed within the larger context of American political history by aggregating and annotating hard data on population, presidential elections, Congress, the Supreme Court, the Cabinet, the U.S. economy, and the federal budget and debt. The Timeplot provides a new lens into American political history; it is not intended to be absorbed at a glance, but rather to be visited and revisited over time.


A beautiful poster, and a very impressive infographic design.  Very Tufte-like in its infographic design, which is no surprise since Nathaniel was a student of Edward Tufte at Yale.  

At its heart, this is a fantastic mix of timelines.  Additionally, the poster is an incredibly detailed infographic that includes things like the time period of each President, the balance of Congress during each term, approval ratings, population growth, the U.S. GDP, the Federal Budget, unemployment, election cartograms and statistics, a biography of each President’s political history and so much more.


The high-resolution infographic is available on the Timeplots site using Zoomify, but it really shines as the printed poster.  You can order the printed 32”x48” poster from the Timeplots.com site for $45, or a smaller 24”x36” version for $30. 


Great job to the entire team at Timeplots!  Later today, I’ll post a behind-the-scenes interview with Nathaniel.

Wednesday
Jun092010

iPhone 3GS vs. iPhone 4 infographic


From the iPhone team at Mahalo, the iPhone 4 vs. iPhone 3G infographic does a good job covering the bases on what’s new about the new iPhone.  But Jason Calacanis asked at the end of the post “any ideas of how to improve?”  So I offer my infographic suggestions:

  1. Visualize the data accurately.  It the battery section the bars shown are 8 bars for 5 hours and 12 bars for 7 hours.  Based on that scale, the 7 hours should only be 11.2 bars. Matching the numbers exactly with 5 and 7 bards would be easier for the readers to comprehend. The small bar chart in between is redundant.
  2. Do something to visualize the increase in processor speed and RAM.  Don’t just list numbers.
  3. Do something to visualize the megapixels of the camera, don’t just list the numbers.  A square showing the area covered by each resolution would be good.
  4. Same with the screen resolution, do something to visualize how many more pixels or on the display
  5. The 24% thinner looks like an after thought, make size and dimensions its own category
  6. Don’t show 8GB, 16GB and 32GB memory cards all the same size.  Visualize the differences.

 What would you suggest as improvements?