About
Randy Krum
President of InfoNewt.
Data Visualization and Infographic Design

Infographic Design

Infographics Design | Presentations
Consulting | Data Visualizations

DFW DataViz Meetup

Join the DFW Data Visualization and Infographics Meetup Group if you're in the Dallas/Fort Worth area!

Search the Cool Infographics site

Custom Search

Subscriptions:


Feedburner

The Cool Infographics® Gallery:

How to add the
Cool Infographics button to your:

Cool Infographics iOS icon

- iPhone
- iPad
- iPod Touch


Read on Flipboard for iPad and iPhone

Featured in the Tech & Science category

Flipboard icon

Twitter Feed
From the Bookstore

Caffeine Poster

The Caffeine Poster infographic

Entries in budget (41)

Friday
Aug012008

Small Gambling Addiction Spending Visual

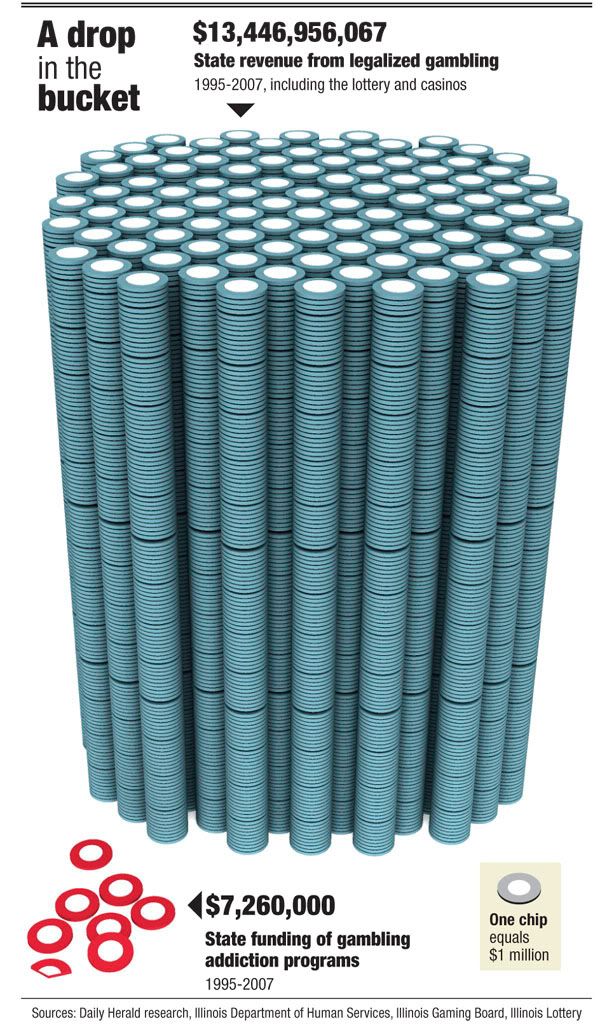
I love this very simple but powerful visual comparison of the gambling revenues and the money spent on gambling addiction support programs.  The author is only trying to communcate one point, and gets his message across very stongly.  I believe it was done by Tim Broderick, from the Daily Herald.

Found on InfographicsNews.blogspot.com.  Looks like

Monday
Jun232008

Obama Funding Graphic


A small poster from our friends at XPLANE,

How Obama Reinvented Campaign Finance Barack Obama is the first major candidate to decline participation in the public financing system for presidential campaigns. Heโ€™s found a more effective way to raise money โ€” by leveraging the power of the American people through online Social Networks.
Available as a PDF formatted for printing on 11x17 paper.

Monday
Jun162008

The Cost of Gadgets


From Wired.com, this is really a 3-dimensional chart. I liked it because there are very few 3D charts that actually portray 3 dimensions of data. (This is actually 4D if you include the different products as a dimension) Usually 3D charts are just bad use of chart styles from PowerPoint. I also like the perspective from above. Although unusual, it helps to see the whole chart.

Monday
May052008

Where Does the Money Go?


From the nytimes.com, this graphic visually represents how average consumer spending breaks down, and the color code shows how much spending in that category has changed in the last year. For example, Gasoline is 5.2% of an average consumer's spending, and it has risen 26% from 2007 to 2008.

As far as I can tell, this is actually a treemap, but in a new shape. More details pop-up when you mouse over each of the individual shapes.

Thanks to Tony, for sending in the link.

Tuesday
Jan222008

Nichloas Felton's 2007 Annual Report


Nicholas Felton has published his new 2007 Annual Report. I love the way he breaks down his own personal life into maps and charts. I had just posted about his 2006 Annual Report last month.

Sunday
Dec232007

Miraculous Logistics Behind Operation Christmas


Holiday Infoporn from Wired.com.

Here's our theory: There is, in fact, a nonsupernatural Santa. It's a transnational corporation with one mission-critical fulfillment goal: Every kid who celebrates the holiday gets a toy on Christmas eve.
Check out the side-scrolling timeline at the bottom. I think they should have included Chinese New Year.

Tuesday
Oct302007

Lotteries Profit, but Do Students?


Interactive graphic, from the NYTimes:

Lotteries in 42 states and the District of Columbia rake in billions of dollars, but much of the cash from ticket sales gets channeled back into prizes and lottery administration. States earmark the profits for programs like education, but the lottery dollars contribute only a small percentage of the total education funding.

Saturday
Aug252007

Consumer Spending (5% on Tech Stuff)


From Wired magazine (issue 15.08) a treemap infographic of consumer spending in 2005. 5% of all consumer spending was on technology, and of course, Wired broke down that 5% into an expanded treemap.

Internet access +216%, Residential phone -25%. VOIP seems to be making an impact.

Sunday
Jul222007

Death and Taxes 2008

NEW Death and Taxes infographic for 2008!


It is the 2008 Federal discretionary budget of the United States. is a representational poster of the federal discretionary budget; the amount of money that is spent at the discretion of your elected representatives in Congress. Basically, your federal income taxes. The data is from the President's budget request for 2008. It will be debated, amended, and approved by Congress by October 1st to begin the fiscal year.
So this is what the President is asking for, not the final budget. Compare this to the final 2007 discretionary budget from my earlier post.

An interactive Flash version is online at www.thebudgetgraph.com/poster.

Saturday
Jul212007

Top Presidential Contributions 1Q


It's early for the 2008 election, but major campaign funding has already started. It will be interesting to see if more money early in the race makes a difference in the outcome.

From washingtonpost.com