About
Randy Krum
President of InfoNewt.
Data Visualization and Infographic Design

Infographic Design

Infographics Design | Presentations
Consulting | Data Visualizations

DFW DataViz Meetup

Join the DFW Data Visualization and Infographics Meetup Group if you're in the Dallas/Fort Worth area!

Search the Cool Infographics site

Custom Search

Subscriptions:


Feedburner

The Cool Infographics® Gallery:

How to add the
Cool Infographics button to your:

Cool Infographics iOS icon

- iPhone
- iPad
- iPod Touch


Read on Flipboard for iPad and iPhone

Featured in the Tech & Science category

Flipboard icon

Twitter Feed
From the Bookstore

Caffeine Poster

The Caffeine Poster infographic

Entries in presidential (46)

Wednesday
Aug092017

Landslide for the "Did Not Vote" Candidate in the 2016 Election!

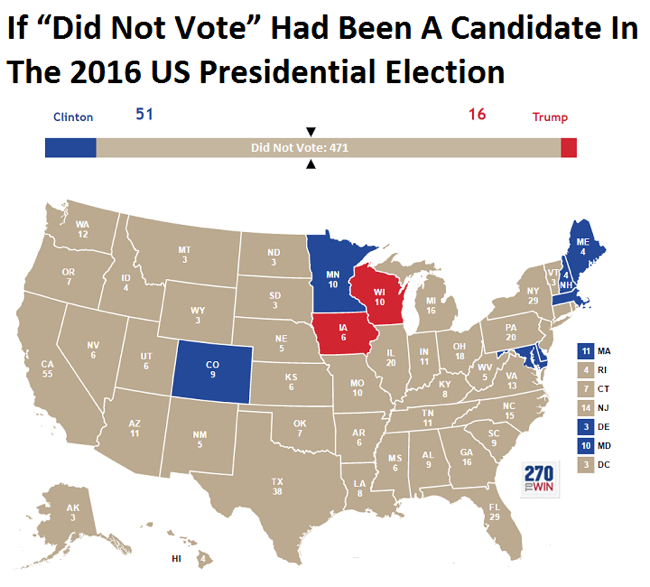
From BrilliantMaps, this is the Did Not Vote Election Map, showing the magnitude if all voting-eligible adults that did not actively vote in the 2016 Presidential election. A Presidential candidate needs 270 Electoral College votes to win. The "Did Not Vote" candidate would have have gathered 41% of the total votes from the voting eligible population, and 471 votes from the Electoral College! A Landslide!

The map above shows what the 2016 US Presidential Election results would have been if votes not cast for Hillary, Trump or one of the third party candidates had gone to fictional candidate “Did Not Vote.”

 As a percentage of eligible voters, Clinton received 28.43% (65,845,063) of all votes compared to Trump’s 27.20% (62,980,160) and Did Not Vote’s 44.37%(102,731,399).

Total voter turnout was estimated to be 55.3% of the voting age population and 59.0% of the voting eligible population.

Map created using 270 To Win, based on reddit user Taillesskangaru’s posts here and updated here.

Disclaimer: The map above was accurate as of January 17th, 2017. Totals below were true at the time of writing but may no longer currently be accurate as additional votes and recounts are conducted.

Thanks to Mike Wirth for sharing on Facebook!

Saturday
Mar042017

Planes, Trains & Automobiles of U.S. Presidents

Official Vehicles of the President of the United States – TitleMax.com – Infographic

Official Vehicles of the President of the United States is an infographic from TitleMax showing the evolution of the vehicles used by Presidents throughout our history.

When the POTUS (President of the Unite States) has to get around, he usually does it in style. And if he’s not in style, at least we know that he’s often surrounded by millions of dollars’ worth of security detail.

Yes, for the U.S. president, cars and vehicles have always been expensive, as has been Air Force One. History has put a spotlight on the presidents’ one-of-a-kind planes: mobile White Houses, with all of the protections therein.

This information is much better shown visually like this infographic than a text bullet list. I would like to see them placed on a timeline to better line them up and show where their use overlapped.

The infographic itself is missing a copyright statement, a citation of sources, and the URL for readers to be able to find the origial full-size infographic published by TitleMax.

Found on Infographic Journal

Thursday
Aug252016

Examining the Real Cost of Donald Trump's Wall

Building Donald Trump's Wall infographic

Real Money has done the math and shared their findings in the infographic Examining the Real Cost of Donald Trump's Wall, designed by DesignBySoap. It appears that the actual cost of the wall would end up being 2-3 times more expensive than the publicly released estimate. Luckily, even many of his supporters do not believe he will build the wall. You can see the details of Trump's plan, as well as some statistics on how Americans feel about it in the infographic above.

Thanks to John for sending in the infographic!

Tuesday
Aug092016

Comparing Presidential Election Forecasts

Comparing Presidential Election Forecasts

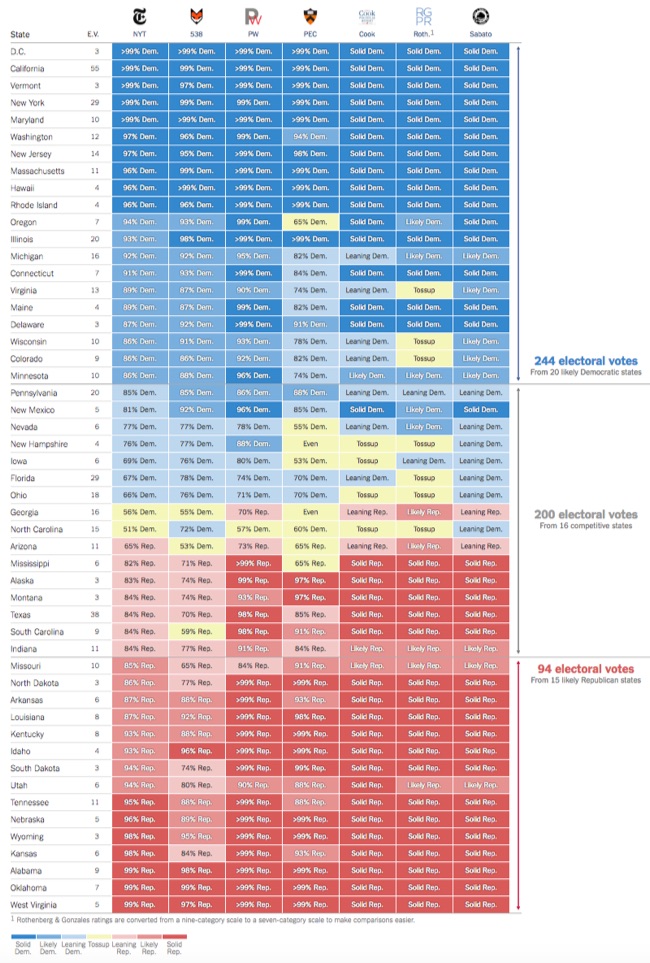
In addition to their own forecast, the NY Times maintains a great graphic Comparison of Presidential Election Forecast Models showing the current results from of seven different election forecasts based on statistical models, expert predictions and even betting markets. The results are updated daily, so check the NY Times site for the most current information!

How Other Forecasts Compare

The New York Times is one of many news organizations to publish election ratings or forecasts. Some, like FiveThirtyEight or the Princeton Election Consortium, use statistical models, as The Times does; others, like the Cook Political Report, rely on reporting and knowledgeable experts’ opinions. PredictWise uses information from betting markets.

We compile and standardize these ratings every day into one scoreboard for comparison.

Each organization’s state-by-state ratings. Viewed together, the differences between the models become much clearer.

They also publish this simple complete prediction comparison showing the total predictions from each group:

Although they have built this in HTML5 on the website, anyone could create a similar comparison graphic style using Conditional Formatting in Excel. This is a great way to highlight differences and outliers in a table of data!

Wednesday
Aug032016

Very Few Americans Nominated Trump and Clinton

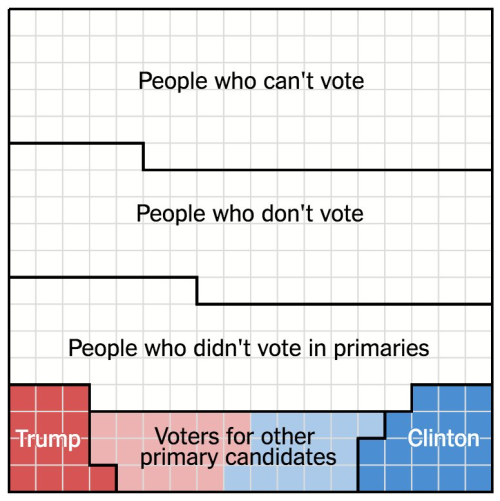
Designed by Alicia Parlapiano and Adam Pearce for the New York Times, this short series of data visualizations tell a very clear story about how Only 9% of America Chose Trump and Clinton as the Nominees For the 2016 Presidential election.

The United States is home to 324 million people. Each square here represents 1 million people.

103 million of them are children, noncitizens or ineligible felons, and they do not have the right to vote.

88 million eligible adults do not vote at all, even in general elections.

An additional 73 million did not vote in the primaries this year, but will most likely vote in the general election.

The remaining 60 million people voted in the primaries: about 30 million each for Republicans and Democrats.

But half of the primary voters chose other candidates. Just 14 percent of eligible adults — 9 percent of the whole nation — voted for either Mr. Trump or Mrs. Clinton.

Mr. Trump and Mrs. Clinton will be working to win the votes of these three groups. Polls suggest they will be separated by just a handful of squares.

If you follow the news headlines, you might think a majority of Americans are in favor of one of our two Presidential nominees, but that would be a misunderstanding of election and population statistics.

This is a fantastic example of storytelling with data, and walking the audience through the data insight step-by-step.

Found on FlowingData


Tuesday
May172016

Election Exodus - Moving to Canada?

Election Exodus - Moving to Canada infographic

Frustrated by the U.S. Presidential candidates? Ready to just pack up and move the Canada? The Election Exodus infographic from SpareFoot looks closer at what it would take for Americans to move North to Canada.

Trump or Clinton.

The prospective of either of these presidential frontrunners emerging victorious in November is too much for many Americans to bear.

A shocking number of U.S. citizens would consider a move to Canada—15 percent if Hillary Clinton is elected and 20 percent if Donald Trump is elected, according to recent polls.  (To be fair, we’re willing to bet there would be plenty of supposed defectors under President Sanders or Cruz as well.)

The question remains: How serious are these people? And how hard is it to move to Canada?

The answers to these questions and more lie below:

Designed by NowSourcing, this is a visually busy take on the side-by-side comparison style of infographic. A lot of text, and many of the statistics are not visualized, which makes it harder for readers to understand all of the information.

Thanks to Brian for sending in the link!

Thursday
Jun052014

Legislative Explorer: Watch Government In Action

Legislative Explorer: Watch Government In Action

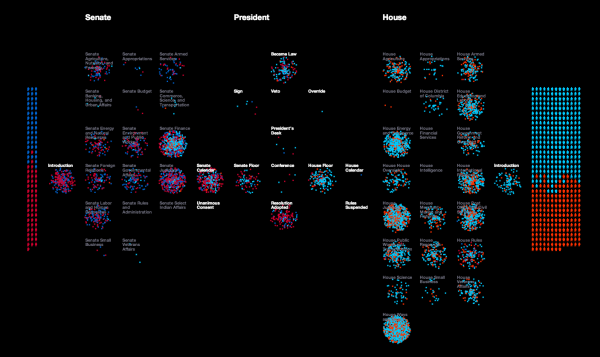
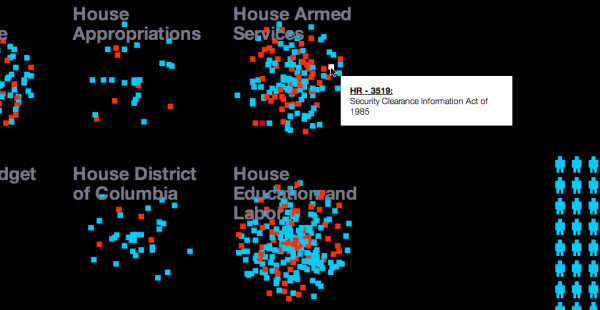
Legislative Explorer is an interactive, animated data visualization that visualizes the process of bills submitted by houses of Congress; the Senate on the left and the House of Representatives on the right.  Designed by Researchers at the University of Washington’s Center for American Politics and Public Policy, it’s a fascinating visualization that is mesmerizing to watch.

A deluge of data is challenging scientific researchers across disciplines to develop new techniques for detecting patterns in large and complex datasets. This general area of research is known as data-driven discovery, or ‘D3.’ Visualizations are a particularly important area of innovation because they help researchers to investigate complex processes at a more holistic level. The goal of Legislative Explorer is to leverage the same benefits of data-driven visualizations to advance understanding of government.

A more in-depth discussion of Legislative Explorer with multiple animations and videos is available at the Center for American Politics and Public Policy.

Anyone can use Legislative Explorer to observe large scale patterns and trends in congressional lawmaking without advanced methodological training. In addition, anyone can dive deeper into the data to further explore a pattern they’ve detected, to learn about the activities of an individual lawmaker, or to follow the progress of a specific bill. Start Exploring!

I selected the 99th Congress (1985-1986) for the screenshots, and you can see the party breakdown of both houses of Congress by their color.  Each icon represents a specific member of Congress which you can identify by hovering your mouse over the icon.  The animation will show a visual spray of bills introduced by members in both houses of Congress as party-color-coded dots that move into committees and through the steps to becoming a law.

Legislative Explorer: Watch Government In Action Zoom 

There are a number of user-definable filters to help narrow down the visualization to a specific party, only one committee, or even just to watching a single bill move through the proces.

Here’s a quick video tutorial:

Found on FlowingData

Thursday
Oct172013

What is the Debt Ceiling?

What is the Debt Ceiling infographic

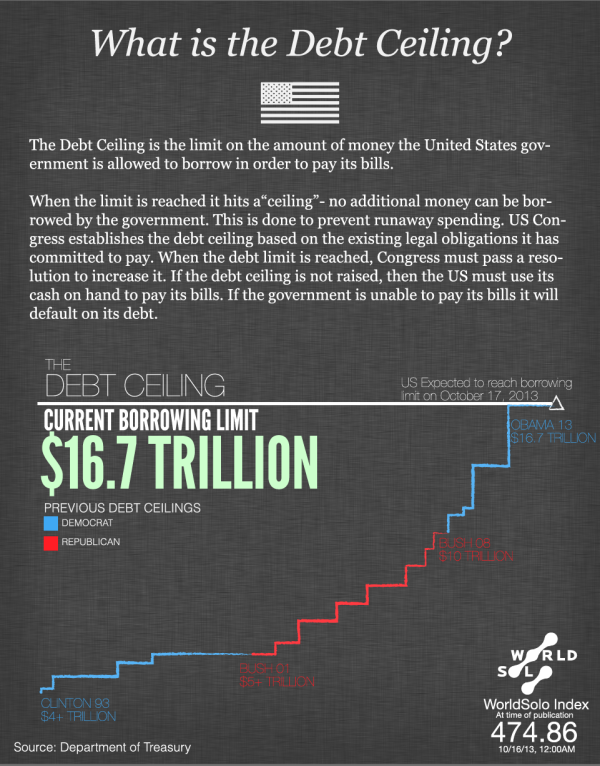
What is the Debt Ceiling? from WorldSolo Index does a good job of using the combination of charts and text to make a complex issue more understandable to the readers.

The US Debt Ceiling is explained. The US is expected to reach its borrowing limit by Oct 17, 2013 if the borrowing limit is not raised. This infographic breaks down the debt ceiling in detail.

Good design that focuses on telling one story really well.

Found on Visually

Friday
Jul262013

Death & Taxes 2014 Poster and Interview

Death & Taxes 2014 poster infographic

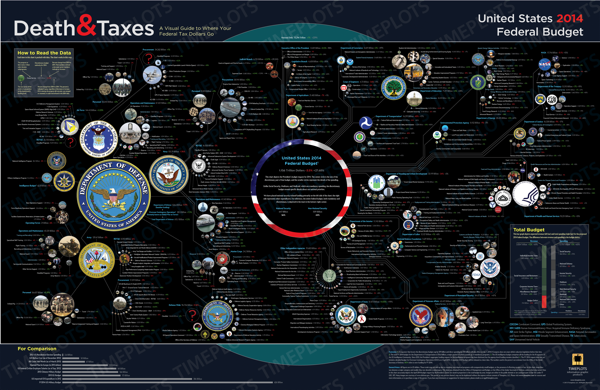
The new 2014 Death & Taxes poster has been released, and it is fantastic!  Visualizing the President’s proposed budget for next year, each department and major expense item is represented with proportionally sized circles so the viewer can understand how big they are in comparison to the rest of the budget.

You can purchase the 24” x 36” printed poster for $24.95.

Since 2004, Death and Taxes has been depicting the federal budget and has grown into a powerhouse of information.

For the FY2014 budget, this poster contains over 500 departments, agencies, programs and just about everything else the government can spend money on. It is still the single most open and accessible record of government spending ever created. All in six square feet. 

Previously, the Death & Taxes series has been a project of Jess Bachman (ByJess.net), but this year the series has been taken over by the great team at Timeplots.  Owner Nathaniel Pearlman graciously spent some time answering some of my questions:

Cool Infographics: What’s new in the 2014 design of Death & Taxes?

Nathaniel Pearlman: Timeplots is continuing the Death & Taxes poster franchise, taking it over from its creator, Jess Bachman. We agreed to do this before the scheduled release of the FY2014 budget. To produce the poster efficiently and meet the expectations of an audience already familiar with its look and feel, we minimized big changes and largely stayed with Jess’s design aesthetic. We kept the location of departments, labeled and colored expenditure numbers in the same format; and, the Office of Governmental Ethics is still the smallest circle plotted on the poster. We did, however, make some subtle design changes.

In the bottom-right corner we converted pie charts to a bar chart. We also changed the “For Comparison” section bubble charts to horizontal bar charts. Bars also serve as a visual clue that the information here is different and you see immediately that they differ from the bubbles depicting the discretionary budget in the main area of the poster. We also unified the presentation style throughout the poster. We also omitted the “How much does it cost you” section. 

Cool Infographics: The Death & Taxes poster design is now being made by the team at Timeplots, what are the major differences from the prior posters that were designed by Jess Bachman?   

Nathaniel Pearlman: Timeplots has a four year history of visualizing complex data with compelling design. We have diverse skills and resources and may introduce changes in future posters like dark type against a lighter background for ease of reading; advancing visual unity either by replacing the photos with icons, or by making all color photographs more duotone, or monochromatic; and finally, crafting the type in the header section so that it has more personality. We are also thinking about how to improve the substance of the poster. We would love to hear feedback or suggestions for improvement from your readers.

Cool Infographics: When did the 2014 data become available, and how long did it take you design the poster?

Nathaniel Pearlman: The data was released on April 11, 2013. To prepare, we wrote some data queries and scripts based on the 2013 data about one week before the release. Once we got the 2014 data, we just ran the 2013 scripts. It took about two days to get all of the circles in place on the poster. The design and crafting took longer. The poster went out for review to experts about a month after the we got the data. Of course we were working on many other projects in between as well.

Cool Infographics: What software applications were used for the Death & Taxes poster design?

Nathaniel Pearlman: Scripting and plotting were done in R—an open source statistical application that we have used for other Timeplots posters. The design completed in Adobe Illustrator. Jess created the previous Death and Taxes with Excel and Photoshop, so there was no code or design template we could borrow or reuse. Our programming and design process was new to Death & Taxes, but we decided to go this route because this process would present data more accurately and make future updating much easier.

Cool Infographics: What’s the most interesting thing you learned from the 2014 data?

Nathaniel Pearlman: We guess it shouldn’t be a surprise, but data shows how trivial in the context of the whole budget are some of the biggest political tangles. Things like the National Endowment for the Humanities or the Corporation for Public Broadcasting are very small by comparison to big ticket items.  The nice thing about the poster is that each viewer will be able to reach their own conclusions, based on the area of they wish to investigate or focus upon. Each department, each item, has its own story. 

Cool Infographics: Where do you have them printed, what are the printing specs and why?

Nathaniel Pearlman: The 2014 poster is on a 36” by 24” sized, 80 lb. cover paper. We use a local printer for offset printing and through a process of several proofs we have more control over the colors and the final look and feel of the print. The 2014 poster is slightly lighter than the 2012 one. The lighter paper can roll more easily into tubes without getting creases.

Cool Infographics: Social media has always been a big part of marketing the Death & Taxes poster.  What are your plans to promote the 2014 poster?

Nathaniel Pearlman: Social media is important to us. We have been receiving supportive comments and thoughtful suggestions through a number of channels. Death & Taxes has its own Facebook channel: (https://www.facebook.com/pages/Death-and-Taxes/373639641532). You can also follow Timeplots on Twitter (@timeplots) and Facebook (https://www.facebook.com/timeplots) to receive notice of latest news. Keep your eyes open to these places.

Graphicacy, (the consulting arm of Timeplots) is also working on an interactive version using the same budget data to pair with the poster. That interactive, presenting the same information, will enable interested viewers to explore the federal budget online.

The poster now sells at Timeplots and Amazon.  

Cool Infographics: Prior versions have been available online in a zooming viewer.  Is the 2014 version also available in this format?  What zooming tool is being used?

Nathaniel Pearlman: Yes, you are able to zoom on a watermarked version of the 2014 poster on our Timeplots site. The zoom tool is the default for our shopping content management system, and it allows for crystal-clear views of the information, watermarks aside. While you will have a good sense for the design and presentation of the poster by viewing it online and zooming-in on its details, we believe the print poster will surprise you with its vibrant colors on smooth paper, sharp type, and scale.

 You can also check out Jess Bachman’s thoughts about the new version in his blog post on Visual.ly

Monday
Jul222013

What the Health? Understanding Obamacare's 11 Year Health Plan

What the Health? Understanding Obamacare's 11 Year Health Plan infographic

Interested in the new health plan but have no idea what it means? What the Health? Understanding Obamacare’s 11 Year Health Plan infographic from Clarity Way breaks down each year of the 11-year health care plan of Obamacare. 

If the re-election of Barack Obama as America’s 44th President of the United States means anything, it is that American citizens can expect a little more consistency within their legislation. Among the most notable acts of legislation promised by Obama during both of his campaigns for the Presidency was the concern over America’s health care system.

When our 44th President first earned his chair in leading the nation, he immediately took initiative to put into action a new proposal for health care reform called the Affordable Care Act. And now that he has regained his position, we can count on seeing this initiative furthered in the next 4 years!

But among this 11 year plan was a ton of confusing political jargon, making it easy for Americans to misinterpret how the Act would impact themselves and their nation. So as a duty to our followers and role in the promotion of health, we wanted to create a little bit easier of an explanation of the Affordable Care Act!

This health reform infographic breaks down the Affordable Care Act in an effort to explain how it will affect each and every citizen, from small businesses to large ones, college students to parents, and senior citizens to the young! It’s important that you know about the Affordable Care Act and understand that if we had maintained our status-quo, over 14,000 Americans would lose their health insurance daily!

I think there’s too much text in this design, but it does walk the reader through each year, step by step.  The statistics should have been visualized.  Big fonts are NOT data visualizations, and I see this done by designers all the time.  Big fonts don’t provide any context, and don’t make the numbers any easier for the audience to understand.

Thanks to Adrienne for sending in the link!