About
Randy Krum
President of InfoNewt.
Data Visualization and Infographic Design

Infographic Design

Infographics Design | Presentations
Consulting | Data Visualizations

DFW DataViz Meetup

Join the DFW Data Visualization and Infographics Meetup Group if you're in the Dallas/Fort Worth area!

Search the Cool Infographics site

Custom Search

Subscriptions:


Feedburner

The Cool Infographics® Gallery:

How to add the
Cool Infographics button to your:

Cool Infographics iOS icon

- iPhone
- iPad
- iPod Touch


Read on Flipboard for iPad and iPhone

Featured in the Tech & Science category

Flipboard icon

Twitter Feed
From the Bookstore

Caffeine Poster

The Caffeine Poster infographic

Entries in Google (32)

Wednesday
Feb212018

16 SEO Myths You Should Ignore Completely

16 SEO Myths You Should Ignore Completely infographic

SEO or Search Engine Optimization can be a tricky subject. The 16 SEO Myths You Should Ignore Completely infographic from My Biz Niche gives some clarity to some popular misconceptions.

From the very beginning, the world of SEO has been rife with myths that have somehow managed to pass themselves off as facts and fool a whole generation of webmasters and even SEO practitioners. After proving itself indispensable in increasing traffic and achieving prime rankings in the SERPs, SEO should be free of these myths by now. But several Google algorithm updates have passed, and these myths still stand and continue to mess with the heads of webmasters and SEO practitioners alike.

This is a very text-heavy topic and design. There's no data to visualize, but the descriptions are short, and easy to understand. If readers want more information, that's available on the website.

Found on Rocks Digital!

Friday
Jun172016

Pay Per Click Checklist

Pay Per Click Checklist infographic

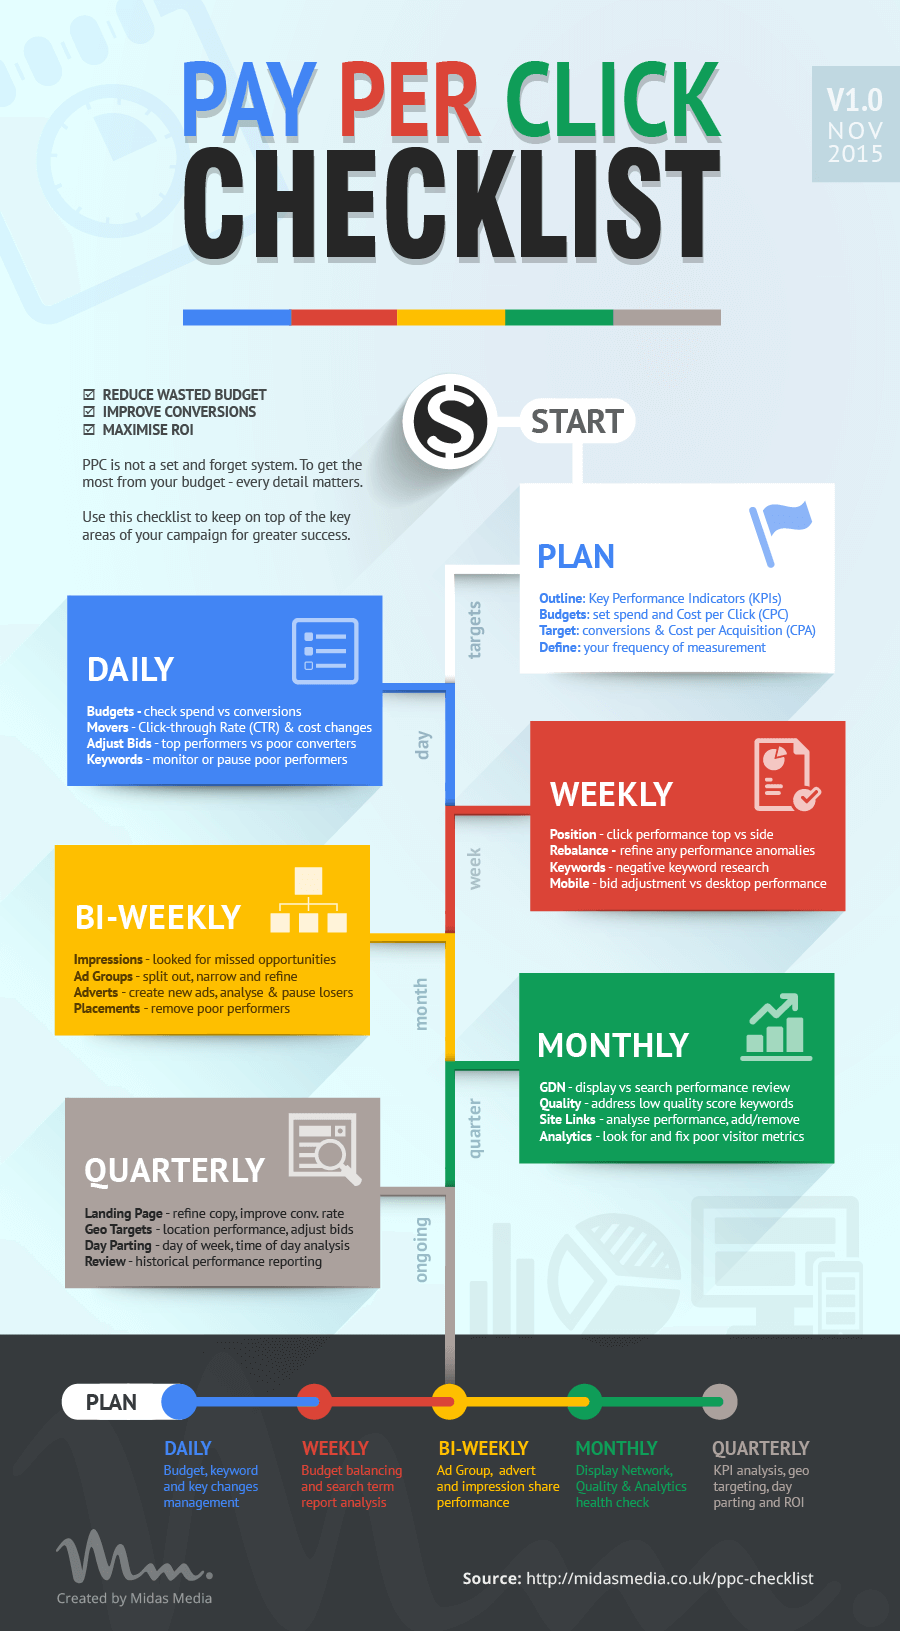
When you have an AdWords PPC campaign, it is not a set-and-forget system. To get the most from your system, you should follow an on-going, structured plan like the Pay Per Click Checklist infographic. Midas Media has designed this simple infographic to maximize your PPC results.

When you hear people talk about Pay per Click (PPC) Management they typically mean Google AdWords.

That said, PPC now spans a whole spectrum of platforms from social media, content, display and of course ‘the daddy’ Google search itself.

This actionable PPC optimisation checklist is directly attributed to managing an AdWords PPC campaign, but it’s fair to say it can be applied to other paid search marketing too. It can also be used as the basis for a campaign review and audit check list.

This is published on the landing page as a good combination of longer article with more in-depth detail, and a simple infographic that is easy to understand and share.

Thanks to Ed Leake for sending in the link through Twitter.

Friday
Dec042015

What Social Media Platforms Are Best Suited For Your Business

It doesn't matter if you have a well established business or a new one, everyone can benefit from learning to use social media better. But which platform is right for you? The What Social Media Platforms Are Best Suited For Your Business infographic from Quick Sprout helps you determine which platform your target audience uses so you can save yourself some time.

With all the social media sites available today, which ones should you leverage? In an ideal world, you would use them all. As a small business, however, you don’t have enough time and money to do so.

With your limited resources, which social media platform would you pick?

If you think Facebook and YouTube are your best bets because they are most popular, think again. Just because a site is popular doesn’t mean it is a good fit for you business.

To help you decide which social media platform is best suited for your business, I’ve created an infographic that explains what social sites you should be leveraging based on real data.

Good use of colors and logos to differentiate the different services. This infographic is a good example of the difference to readers between visualized data and text-only data. Readers' attention will gravitate to the visualized statistics, and any numbers shown as just text are often skipped and considered to be secondary information.

Thanks to Juntae for the link!

Thursday
Dec032015

Why Do People Uninstall Apps?

Why Do People Uninstall Apps? infogrphic

Why Do People Uninstall Apps? Well according to ITR, a company that specialises in translation and localization services for software applications, the most overwhelming reason for uninstalling apps is that they take up too much space! The infographic covers; how long we keep apps for, why apps are being uninstalled, the 8 most common design mistakes, and the difference between the Apple store and Google Play.

There are currently 1,000 apps being created and added to the app stores every day. With the continuous creation of apps, how long does a user actually keep an app for and what are their reasons for uninstalling?

Found on MarketingProfs

Thursday
Aug132015

Android Fragmentation Visualized

Android Fragmentation Visualized

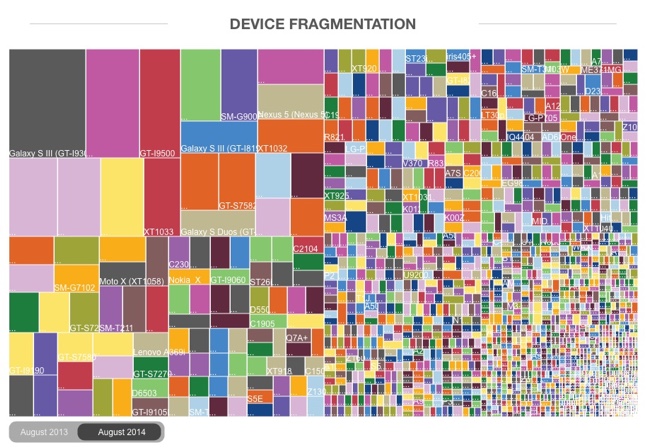
This one data visualization can demonstrate why mobile responsive web design is important: Android Fragmentation Visualized. OpenSource published a number of data visualizations, both static and interactive, that show the tremendous market fragmentation in the market of Android phones and devices. This treemap shows market share by device.

Fragmentation is both a strength and weakness of the Android ecosystem, a headache for developers that also provides the basis for Android’s global reach. Android devices come in all shapes and sizes, with vastly different performance levels and screen sizes. Furthermore, there are many different versions of Android that are concurrently active at any one time, adding another level of fragmentation. What this means is that developing apps that work across the whole range of Android devices can be extremely challenging and time-consuming.

Despite the problems, fragmentation also has a great number of benefits – for both developers and users. The availability of cheap Android phones (rarely running the most recent version) means that they have a much greater global reach than iOS, so app developers have a wider audience to build for. Android is successfully filling the gap left behind by the decline of Nokia’s Symbian – and in this report we look at the different shape of fragmentation in countries from different economic positions, as a way of showing that fragmentation benefits Android much more than it hurts it. Android is now the dominant mobile operating system and this is because of fragmentation, not in spite of it.

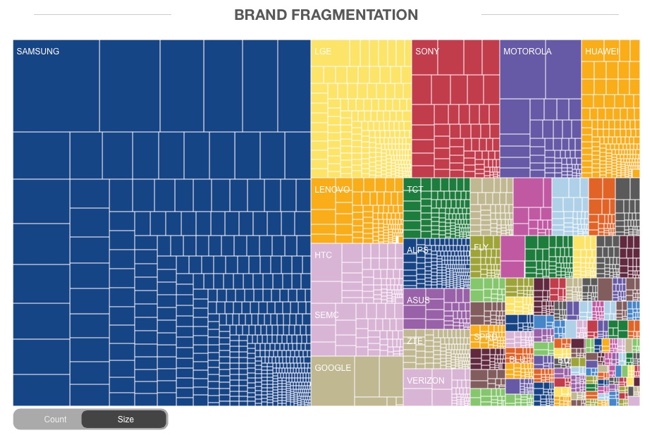
Here you can see the same treemap reorganized into brand clusters, still sized by market share:

Android Fragmentation Visualized

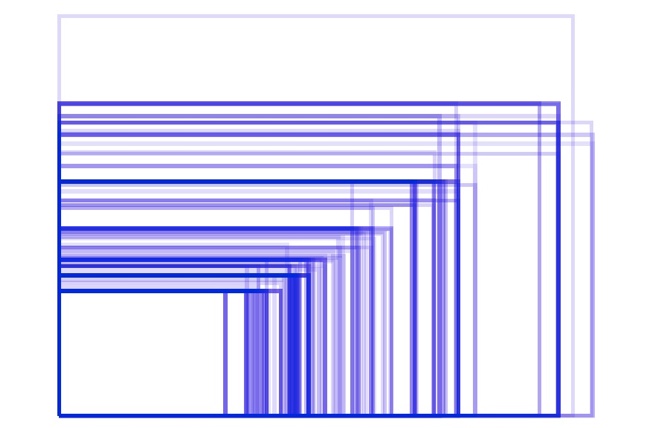
The hundreds of different Android screen sizes can be seen in this visualization:

In contrast, Apple currently only has FIVE devices and screen sizes for phone and tablets, but uses the same screen resolution on a couple of them:

Found on Business Insider

Friday
Jan022015

SEO Rank Correlations and Ranking Factors 2014

SEO Rank Correlations And Ranking Factors 2014 infographic

The SEO world is constantly changing. The SEO Rank Correlations and Ranking Factors 2014 infographic is your guide to good rankings! The infographic was created by Search Metrics, and they determined that the most important factors to optimal SEO is high quality!

We made it and just in time for this fall’s season. So download Ranking Factors 2014 on your tablet or smartphone because this study will be your best SEO read yet. Last year’s Ranking Factor study placed positive emphasis on good content, onpage technology and social signals that correlate with better positioned websites.

Get the latest and greatest SEO Ranking Factors and Rank Correlations 2014 – Google U.S. and get an in depth definition and evaluation of the factors that have a high rank correlation with organic search results.

A great way to summarize the top level findings from a longer report. This is a detailed infographic, but the information is incredible valuable.

I wish more of the numbers and statistics were visualized. Big fonts are not data visualizations!

Found on Business2community.com

Monday
Dec012014

The Internet Is a Zoo: The Ideal Length of Everything Online

The Internet Is a Zoo: The Ideal Length of Everything Online infographic

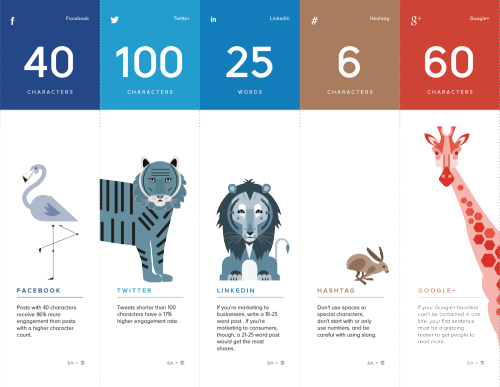
Short, sweet, and to the point! The Internet Is a Zoo: The Ideal Length of Everything Online infographic from a partnership between SumAll and Buffer explains the fine line between when extra words are helpful, and when they become too much information. Whether you are posting a facebook post to your friends, or a blog post to your avid followers. This infographic will help make sure your posts reach the most readers!

Have you ever woken up in cold sweat in the middle of the night wondering exactly how many characters long a tweet should be to get the most engagement, or how many words long a blog post should be so that it actually gets read?

Ok, that may just be me, but knowing exactly how many characters a Facebook post should be or what the ideal subject line length is should be endlessly fascinating (and useful) information to most people who are active on social media.

So, to make all this data digestible and easy to understand, we partnered with our awesome friends over at Buffer to produce an infographic that shows the optimal length of pretty much everything on the internet.

Great design that tells one story really well, totally focused on the length of posts on different social media platforms. The footer should include the URL to the infographic landing page so readers can find the full-size original when the infographic is posted without links.

They went one fantastic step further, and created a more print friendly version near the bottom of the landing page that spans multiple printed pages. The pages are formatted to fit on standard Letter-size paper or in presentation slides. This is a great example of using the research and design from the original infographic to share the information in additional formats.

Infographic was found on SumAll

Wednesday
Sep242014

How To Be a Google Power User

How To Be a Google Power User infographic

Sometimes, no matter how you word your question, Google’s search engine’s results will not come up with what you are looking for. How To Be a Google Power User infographic from Who is Hosting This? tackles the Google search engine problem with a few tips and tricks to help you find the answers to the questions you are seeking.

It’s a familiar frustration for most of us: You type your precise, specific search terms into Google, and expect to find what you need on the first page.

Instead, you’re faced with millions of search results, and the first few links are so off-the-wall unrelated you wonder if you mistyped something.

But your search terms are correct, so why doesn’t Google know what you’re looking for? And how are you supposed to narrow down the millions of irrelevant results?

Luckily, Google has quite a few hidden tips and tricks for searching that will help you quickly find exactly the results you’re looking for.

Just by learning a few formatting and punctuation tricks, you can tell Google how your search terms are related, or exclude certain words or phrases. You can also narrow down your search with criteria like location or pricing, or use Google to search within a single website.

If you’re still not getting the results you need, Google has several other little-known features that can widen your search. Webmasters can easily find images for their websites and blogs with Google Images, and researchers need only visit Google Books or Google Scholar to search through print publications and research papers in any field.

Faster and more accurate searches aren’t the only benefit to becoming a Google power user. Google also has a few hidden functions you can unlock with the right search query, including calculations and conversions, stock quotes and sports scores, and film showings and flight statuses. With the right search, you can get immediate results telling you the current weather and today’s sunrise and sunset times, or quickly look up the definition of a word and get a translation into one of dozens of available languages.

With the time you save as a Google power user, you’ll even be able to fit in a game of Atari Breakout on Google Images. Just follow the steps int he infographic to find out how!

This is a great instructional, how-to infographic design. It’s informative, without making any kind of hard sales pitch for a companies products or services, and that usually leads to more sharing activity.  It would help to have the URL to the original infographic landing page in the footer.

The color scheme is spot-on with Google as the topic, and the sections are easy for readers to follow with minimal text. For example, the design shows you how to use the Search Operators using an example without a lengthy text explanation.

Found on Digital Information World and State of Digital

Monday
Mar242014

How Google Glass Works

How Google Glass Works infographic

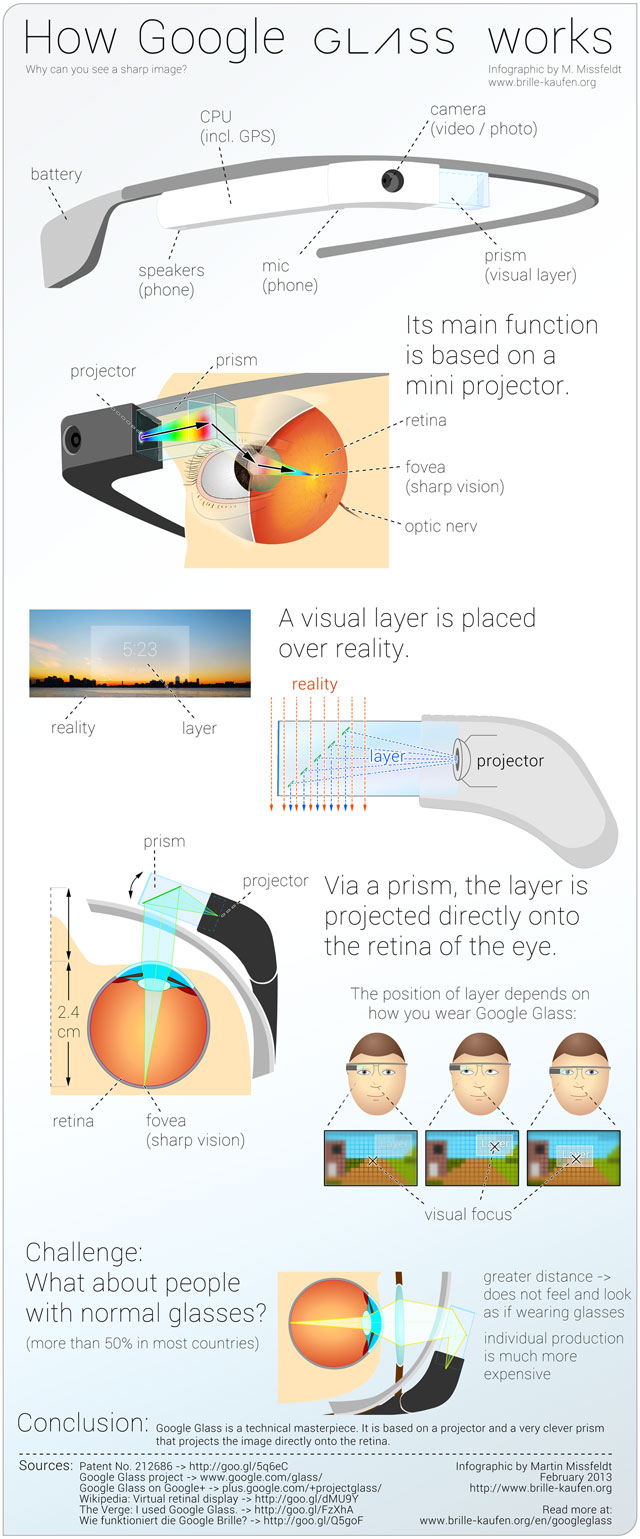
The Google Glass phenomenon has gotten a ton of coverage from the tech press, but how does it work? Creator Martin Missfeldt explains the inner workings in his How Google Glass Works infographic.

How does it work, Google’s new Glass? Why can you see with it a sharp image-layer? How does the image overlay the image of reality? The following infographic illustrates the optical principle - very simple and easy to understand.

Google Glass is a technical masterpiece. It combines numerous functions and features in a very small unit. In addition to phone and camera (photo, video), it offers Internet connection, including GPS.

The core feature of Google Glass is a visual layer that is placed over the reality (“augmented reality”). This layer opens a door to amazing new possibilities. But how does it work? In the Google Glass contains a mini-projector, which projected the layer via a clever, semi-transparent prism directly on the retina in the eye. Because of this the image, even though it is so close to the eye, is sharp and clear. You can move the front part of the Google Glass easily to optimize the focus.

This informative infographic is a great how-to explanation of the science and technology built into Google Glass.  Illustrations and images are used in this design to tell the story instead of data visualizations.

A German version of the infographic was also published.

Found on http://www.educatorstechnology.com/2013/05/a-great-visual-guide-on-how-google.html


Wednesday
Mar052014

Hungry Tech Giants

Hungry Tech Giants Interactive Infographic

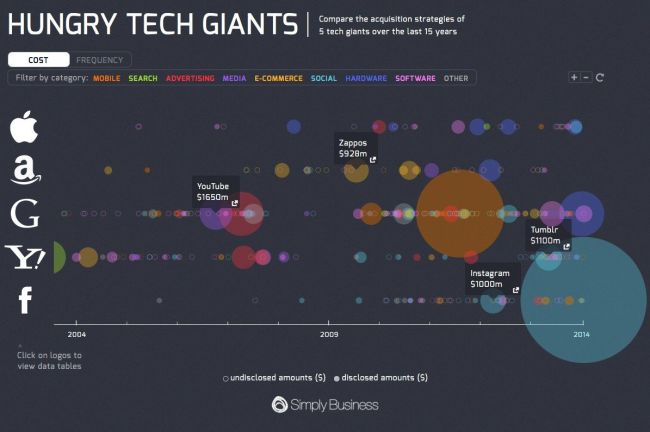
Hungry Tech Giants is a cool infographic from Simply Business that is both zoomable and interactive!  To put them into context, the design visualizes 15 years of tech company acquisitions by Apple, Google, Yahoo, Amazon, And Facebook.

2013 was a busy year for tech acquisitions.

With competition in the tech space heating up, Apple, Amazon, Google, Yahoo, and Facebook collectively executed 65 acquisitions in 2013 alone.

Yahoo was the biggest acquirer of 2013, buying a total of 25 companies following the hiring of its new CEO, Marissa Meyer.

Although Meyer is best known for her acquisition of Tumblr, the majority of her deals have bought engineering talent in an effort to build Yahoo as a serious challenger to Google.

Apple also had their biggest ever year for acquisitions in 2013, with ten purchases in total.

To see all of the acquisitions in detail, please visit our interactive microsite.

Each acquisition is appropriately placed on the timeline, and shown as a circle sized to match the total acquisition price.  Solid circles shown known prices, and open circles are not sized because the acquisition amount was never released publicly.  The circles are also color-coded to represent the different categories.

The interactivity allows you to select which categories to show, and when you hover over any particular acquisition, the acquired company name is shown with a link to the press release or news story announcing the acquisition.

The zooming controls allow you to adjust the date range shown, which helps identify many of the overlapping circles.  Clicking on the company logos on the left also brings up the data table which shows all of the known values, dates and includes the links to the press releases.  A very good way to establish credibility and make your data sources transparent.

The overall design is meant to be very detailed and allow the audience to dig in and explore the data.  At the macro level, the infographic clearly puts Facebook’s $19B acquisition of WhatsApp into context as the largest tech acquisition of all time!

Found on TechCrunch and Cult of Mac!