About
Randy Krum
President of InfoNewt.
Data Visualization and Infographic Design

Infographic Design

Infographics Design | Presentations
Consulting | Data Visualizations

DFW DataViz Meetup

Join the DFW Data Visualization and Infographics Meetup Group if you're in the Dallas/Fort Worth area!

Search the Cool Infographics site

Custom Search

Subscriptions:


Feedburner

The Cool Infographics® Gallery:

How to add the
Cool Infographics button to your:

Cool Infographics iOS icon

- iPhone
- iPad
- iPod Touch


Read on Flipboard for iPad and iPhone

Featured in the Tech & Science category

Flipboard icon

Twitter Feed
From the Bookstore

Caffeine Poster

The Caffeine Poster infographic

Entries in Google (32)

Monday
Dec092013

Google’s 200 Ranking Factors

Google’s 200 Ranking Factors infographic

Google’s 200 Ranking Factors is a very detailed list of the known 200 aspects that Google considers in their ranking formulas.  The overall length of the infographic is the major visual feature that catches your attention, and communicates a clear message about Google’s immensely complicated algorithm and how difficult SEO can be.  The second level of of the design is the actual details about each and every one of those ranking factors that the audience can read if they want specific information.

Google has confirmed that they use approximately 200 ranking signals in their algorithm. However, they’ve never publicly listed them all. While this infographic is by no means official, it aggregates the best information we have about how Google ranks pages and websites.

The infographic was published on Entrepreneur.com, designed by Single Grain and based on information collected and published by Backlinko.

Found on Holy Kaw! and Search Engine Journal

Wednesday
Nov132013

How to Setup Google Authorship in 6 Minutes

How to Setup Google Authorship in 6 Minutes infographic

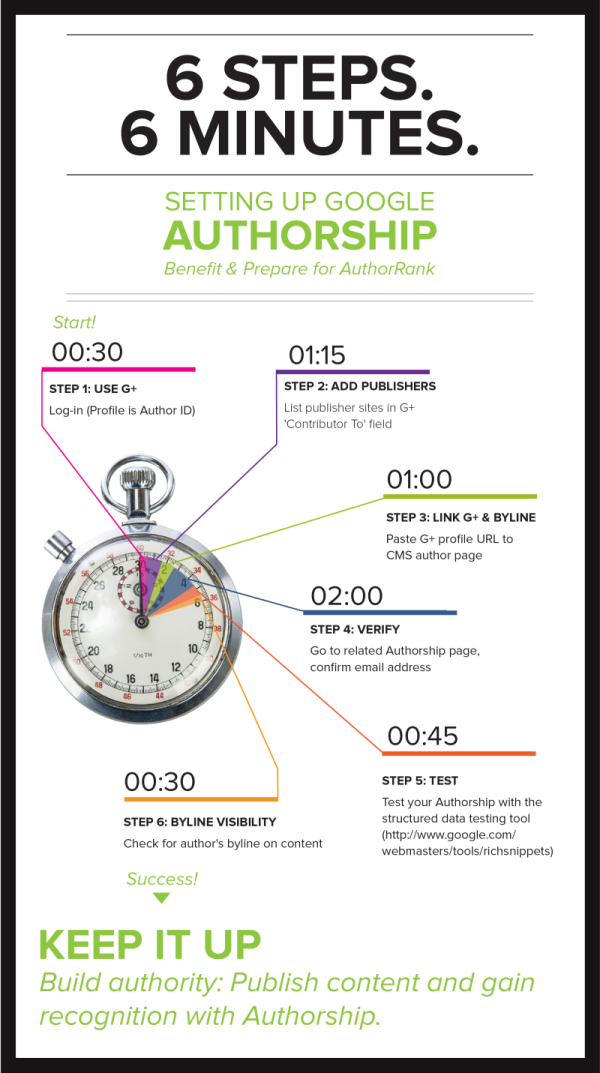
How to Setup Google Authorship in 6 Minutes is simple, clear, focused design from Brafton.

Google Authorship helps brand publishers personalize the custom content they post to their websites. Studies show that including an author’s byline and headshot in search engine results pages (SERPs) increases clicks and may eventually improve PageRank. 

Brafton’s “Content marketing, meet Authorship” resource outlines everything a savvy marketer must know to benefit from Google technology, and our accompanying infographic makes it even easier to setup Authorship on a given site. (Our downloadable resource includes a print-friendly version of this graphic!) Follow these six steps (in about six minutes) to be on your way to publishing online content using Google Authorship. Don’t forget to read our related blog: Why It’s Time to Embrace Authorship, and download our free resource.

This infographic design keeps it simple for readers by telling one short story really well.

Knowing that the PNG image file of the infographic will be shared on other sites, the design should have included the Brafton logo, a copyright statement, and the URL for readers to follow to find the original, full-size version of the infographic.  Not all bloggers are good about linking back to the original landing page.

Monday
Oct072013

The Perks of Working at Google, Facebook, Twitter and More

The Perks of Working at Google, Facebook, Twitter and More infographic

When you get on your computer and pull up Google or Facebook, do you ever wonder about the people that make the site run? Resumebear put together an infographic for Mashable called The Perks of Working at Google, Facebook, Twitter, and More to share information like “Amenities in the Office” or “Medical and Retirement Benefits”. After reading about these jobs, you might decide to apply there yourself! 

It’s no secret that Silicon Valley has a problem finding the talent it needs to fill all the high-tech jobs available in the region. The area expects jobs in information and communications technologies to grow 15 percent during the next two years, Menlo Park Patch reports.

The trick for many employers is how to attract — and keep — the best talent in the field. Beyond handsome salaries, many tech firms also lavish their workers with benefits, leading to some unique and even quirky offerings.

Such corporate perks can be as simple (and routine) as Facebook’s discounted gym memberships or the onsite gyms at search-engine giant Google and Gaia Online, an animation-themed social networking site.

Great use of icons and illustrations to show a comparison between company benefits!

Found on mashable.com!

Wednesday
Oct022013

Measuring Google AdWords Conversions

Measuring AdWords Conversions in a Multi-Screen World infographic

Google AdWords released some fantastic stats about cross-device conversions on their Inside AdWords blog, and included the infographic Measuring AdWords Conversions in a Multi-Screen World to help communicate some of the information.

Estimated cross-device conversions will begin rolling out globally to all AdWords advertisers starting today and continuing over the next few weeks. To see these new statistics, you’ll need AdWords conversion tracking and a sufficient volume of conversions on which to base a reliable estimate.

In the last few months, we’ve analyzed data across thousands of AdWords advertisers to learn more about cross-device conversion patterns.

More results from other verticals can be seen below.

The visual diagram helps readers understand the information by narrowing down the scope of the data; clearly identifying it as only a portion of the Estimated Total Conversions.   However, they made one of the biggest design mistakes.  Big fonts are not data visualizations!   Making the percentage numbers big doesn’t put these values into context for the readers and doesn’t make the data any easier to understand.

Found on the D/FW SEM Facebook feed.

Monday
Sep302013

15 Years of Google Search

15 Years of Google Search timeline infographic

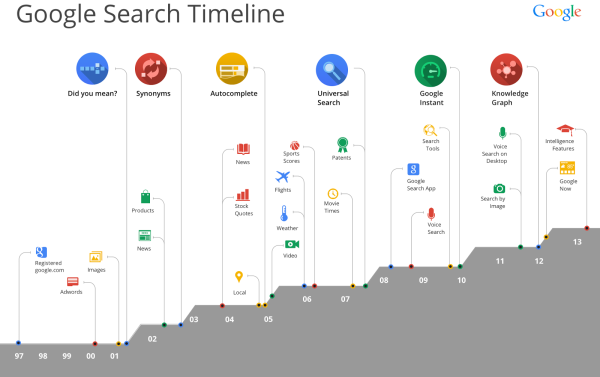
Last week, Google celebrated its 15th year, and posted the Google Search Timeline to help remember how far we have come in that time.

Google Search is turning 15. Remember what it was like to search in 1998? You’d sit down and boot up your bulky computer, dial up on your squawky modem, type in some keywords, and get 10 blue links to websites that had those words. It seemed like magic (and it was way way faster than card catalogs and microfiche!).

The world has changed so much since then: billions of people have come online, the web has grown exponentially, and now you can ask any question on the powerful little device in your pocket. You can explore the world with the Knowledge Graph, ask questions aloud with voice search, and get info before you even need to ask with Google Now.

I love the visual design, with icons and minimal text in the design to show all of the major milestones.  

I don’t understand the increasing area chart across the bottom though.  It isn’t representing any data, and each step up coincides with one of the major advancements across the top.  It’s visual, but it doesn’t have any meaning.  You would think it could show the growing total number of searches or stock price or amount of data processed.

Found on TechCrunch


Friday
Jul122013

Battle of the (Social) Sexes

Battle of the (Social) Sexes infographic

The Battle of the (Social) Sexes infographic from InternetServiceProviders.org explores some of the demographic data behind social media.

You’ve no doubt heard the old, oft-quoted adage, “men are from Mars, women are from Venus,” used to denote the fact that men and women may not always see completely eye to eye. While this light-hearted statement isn’t taken literally, when it comes to the virtual world of Internet interactions, similar sentiments may be formed surrounding the different ways men and women use social networking. While the majority of adults in the US are plugged into some sort of social media outlet, not all of them are used in equal measure, and not all of them are used by both genders equally. For instance, the average Google+ user spend just three minutes per month on the network, while the average Facebook user will spend 405 minutes per month updating statuses, posting pictures, and checking out others’ profiles. So what can be learned about men and women in the world of the web? As is turns out, men and women tend to dominate very different social media networks. The following infographic takes a look at some of the differences between male and female-dominated social media sites: How many users each one has, as well as how they interact.

There’s so really good data they have compiled in here, and most of the data visualizations are easy to understand.  I would not have expected to see that Twitter has 40 million more female users each month.

There are a handful of minor tweaks that would help improve the design:

  • The salmon/orange/peach color for women is unexpected compared to the traditional pink.
  • Go ahead and use the official Twitter and Facebook icons.  No need to design their own.
  • The pie slices for time spent would work much better with colors that are more distinct.  The different shades of gray are very hard to differentiate.
  • For the pie charts, the text label should be placed next to the pie slice its describing, instead of the opposite side as shown in this design.  Flipping the pie charts horizontally would fix that easily.

I appreciate the clear Creative Commons license in the footer, but the URL to the original infographic lansing page is missing.  Since the infographic image file is shared by itself, the URL always helps readers to find the original.

Found on Ragan’s PR Daily


Tuesday
Apr022013

Social Network Overload

Social Network Overload infographic

How often have you checked your social media accounts today? Feeling unplugged is a problem for many people.  Social Network Overload from mylife.com talks about how people are addicted to social media, and what they rather do than give up their Internet lifeline. 

Afraid you’re missing something important on your email, Facebook, Twitter, or other accounts? You are not alone. Two out of three people feel the same way. In the same survey, three out of five people wished there was a solution to monitor their various communication options.

Here’s an interesting infographic based on a survey by Harris which illustrates a growing trend—social media overload

The isometric illustrations of people and the data visualizations are fun, and the light-hearted data makes this one appealing to share.  The design is missing the URL to the infographic landing page, so that readers can find the original when they see thie infographic posted on other sites.

Found on The Undercover Recruiter and Visual Loop.

Tuesday
Feb122013

Breakdown of A Person's Google Results...and How to Look Better

Breakdown of a Person's Google Results: How People Look in Google- and How to Look Better infographic

When you type your name in Google, what comes up? Hopefully nothing negative. The Breakdown of A Person’s Google Results: How People Look in Google - and How to Look Better infographic from brandyourself.com tells you which of your profiles are going to show up higher in google. If your personal image needs a boost, use BrandYourself, a free website that allows you to create a positive image of yourself and land it on the top page of the Google search.

At BrandYourself, our goal is give our users and readers everything they need to put their best foot forward in Google.  Since we track the Google results of over 130K users we were able to analyze millions of results and found some really insightful information.

Want to look better in Google? Think twice about building your personal website on WordPress.

  • Bad First Impression: 1.5 Billion names are Searched everyday in Google but people generally don’t look great on their first page
  • If you want to look better, you need to choose your profiles wisely: For example, LinkedIn is the best social network for rankings, while WordPress is the highest ranking personal site builder. Even more interesting, popular pages like about.me really have trouble ranking high.
  • BrandYourself is effective: To date, we have helped people raise their favorite profiles over 250K positions higher in Google. People can expect to raise a profile over 20 positions, or 2 whole pages, by using our software. We are very proud of this.

We know not everyone loves looking at data as much as we do, so we put it in fun infographic form so you can enjoy it too. Let us know what you think!

This is a great informational design that shares some really valuable information.  I can attest to much of the information, and have the advantage of owning all 10 results on Google if you search for “Randy Krum”.  Go ahead…try it!

A couple recommendations I would make to improve the design:

  • There doesn’t seem to be a higher resolution version available, so some of the font sizes are too small to read.  Especially the Sources list and the design credit.
  • There’s some good data and values in here that would make a better impression if they were visualized
  • There should be a URL to the infographic landing page in the footer, so readers can find the original

Thanks to Patrick for sending in the link!

Monday
Jan142013

SEO & Infographics - an Interview with Eric Enge

Eric Enge, Author and SEO GuruRecently, I had an amazing opportunity to interview Eric Enge about SEO & Infographics.  Eric has incredible insight in the world of SEO as a consultant, author, speaker and entrepreneur.

Eric Enge is the CEO of Stone Temple Consulting, a consulting company that provides a full range of Internet marketing optimization services including: strategic business planning, on page search engine optimization, link building, content optimization, conversion optimization, social media optimization, user engagement, and pay-per-click campaign development and optimization. Eric is co-author of the book The Art of SEO, a speaker at numerous search marketing events, and a contributing author to Search Engine LandSearch Engine Watch, and SEOmoz

 The interview covers some of the hottest topics that impact the infographics design industry today:

  • Infographics as part of a content marketing strategy
  • How Google’s changes to their algorithm impacts infographics
  • Infographics relevance and accuracy
  • Using attribution links, anchor text and embed code for infographics
  • Infographics on Pinterest 

You can read the complete interview on the InfoNewt blog

Thursday
Sep202012

Is Google+ a Ghost Town?

Is Google+ a Ghost Town? infographic

Google+, The newest trend? Or the newest flop? Umpf gets to the bottom of this mystery with a little research and reports it’s results with an infographic! The Google+, Ghost Town? infographic does more than just report the Google+ statistics, it compares them to other key social networks.

There’s been many articles written about how good, bad and indifferent Google+ is.  But our favourite debate is the ongoing It’s Really Popular Vs It’s A Ghost Town one.

So what’s the truth?  Our findings and infographic (see below) appear to suggest the latter: despite its large number of accounts, G+ is bottom of the list of social network users’ favoured channels.

Google, of course, claims it is fast-growing and really popular.  Why wouldn’t they? And, of course, there is research to support that argument. But does this chart, left, for example, which shows the rise in G+ unique visitors, tell the whole truth?

So, we decided to do our own research.  It is by no means exhaustive and is only meant as a snapshot view, so judge for yourself.

Certainly a trending topic lately, but also a really good infographic design.  Of course it’s framed in a Google+ news feed style layout.  Easy to read and colorful.  I like the color coding related to the different social network logos, even though some of those blue colors are hard to differentiate.

In the Users bar chart, I love the use of color, putting the data right in the bars and using the logos on the axis to eliminate any need for a legend.  Good data visualizations design!

In the “Users Likely to Share” I would have liked to see some sizing of the icons to match the data. Instead, they put the icon illustrations into rank order, continued the consistent color coding and clearly identified 1st, 2nd, 3rd, etc.

The section with all of the doughnut charts (reminiscent of the Google+ Circles icon) also continues the consistent color coding.  I’m sure it a rounding issue, but many of the charts only add up to 99.9% instead of 100%.

At the bottom, the two things missing are some type of copyright license as well as the URL linking back to the original infographic landing page.

Thanks to Jon for sending in the link!