About
Randy Krum
President of InfoNewt.
Data Visualization and Infographic Design

Infographic Design

Infographics Design | Presentations
Consulting | Data Visualizations

DFW DataViz Meetup

Join the DFW Data Visualization and Infographics Meetup Group if you're in the Dallas/Fort Worth area!

Search the Cool Infographics site

Custom Search

Subscriptions:


Feedburner

The Cool Infographics® Gallery:

How to add the
Cool Infographics button to your:

Cool Infographics iOS icon

- iPhone
- iPad
- iPod Touch


Read on Flipboard for iPad and iPhone

Featured in the Tech & Science category

Flipboard icon

Twitter Feed
From the Bookstore

Caffeine Poster

The Caffeine Poster infographic

Entries in live (22)

Tuesday
Feb042014

Live Events in Washington DC and Florida

Cool Infographics On The Road February 2014

If you’re located near Washington, DC or Fort Lauderdale, FL, I’ll be there next week!  I have a packed schedule of both public and private events, so check your schedule and join me if you can!  I’ll be presenting about data visualization and infographics, and signing books.  I look forward to meeting you!
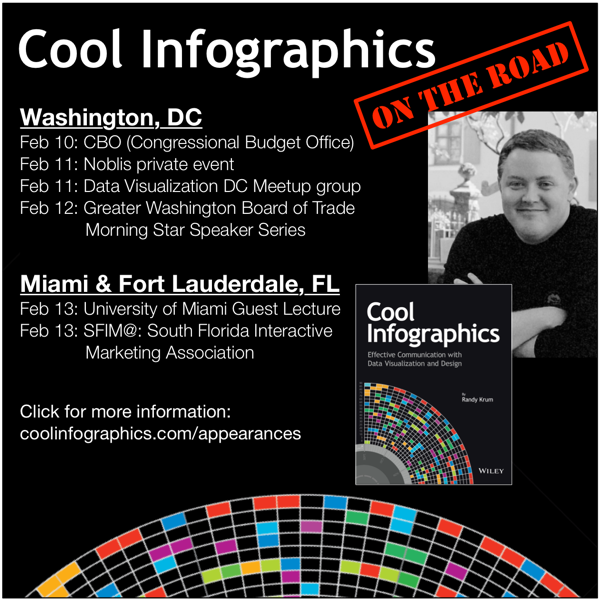
Washington DC

Monday, Feb 10th, 3:00pm CBO (Congressional Budget Office) - private event and book signing

Tuesday, Feb 11th, 12:00pm, Noblis Tech Tuesday - private event and book signing

Tuesday, Feb 11th, 6:30pm, Data Visualization DC Meetup group - PUBLIC presentation, book signing and data drinks!

Register here: http://www.meetup.com/Data-Visualization-DC/events/164211042/

Wednesday, Feb 12th, Greater Washington Board of Trade Morning Star Speaker Series - PUBLIC event

* Discount for Cool Infographics readers - use the code “Cool*Infographics” at checkout to get the member price even if you’re a non-member ($25 discount)!

** No book sales allowed in the Ronald Reagan Building, so you must purchase a book beforehand if you would like me to sign it at the event.  You will be offered the chance to buy a book during online registration.

Register here: http://www.bot.org/events/programs/morning-star-speaker-series/randy-krum.aspx


Miami, FL

Thursday, Feb 13th, 11:00am, University of Miami - Guest Lecturer in Alberto Cairo’s Visual Journalism Infographics class


Fort Lauderdale, FL

Thursday, Feb 13th, 6:30pm, sfim@ (South Florida Interactive Marketing Association) - PUBLIC event and networking

Register here: http://www.sfima.com/EventDetail.aspx?id=872


You can always find my current list of upcoming events on the Appearances page!


Friday
Oct142011

Infographics in the Wild - Submit your photos!

Infographics in the Wild is a new photo group on Flickr started by myself and Robin Richards (ripetungi.com). This photo group is open to everyone.  I post infographics from the Internet here on Cool Infographics almost every day, but there are many, many more examples to be found IRL (in real life) on signs, products, stores, airports, restaurants, etc.  We are asking you to submit any photos of infographics found “in the wild”.

Back in September, Robin posted about Infographics in the wild #1 that he had found around his location in the UK, and we started talking about the idea of starting a photo group where anyone could submit a photo.

I have set the requirement in Flickr that any submitted photos include a geo-tag location so we can also visualize all of the photo locations on the map - just because we all like seeing stuff like that!

Friday
Mar202009

SXSW Twitter Visualizer from Pepsi


The 2009 SXSW PepsiCo Zeitgeist Twitter Visualizer (long name isn't it?) was a great experiment during the 5-day South By Southwest symposium/conference/party in Austin, TX.  Developed by Slash7, the site contains a number of dufferent visualizations using the Twitter APIs.


These real-time visualizations were able to capture only Tweets about the event using the hash-tag #SXSW and highlight the popular topics and show where people were Twittering on a map.  PepsiCo has a bigger site with some additional content at http://pepsico.com/sxsw

Found on Information Aesthetics and of course, Twitter.

Thursday
Aug282008

VizThink Europe Discount Code!


I know many of my readers would really enjoy the conference VizThink Europe, and the conference is coming up quickly.  The Europe version is in Berlin, Germany this year on October 12-14 at Crown Plaza Berlin City Centre.
We'll have lots of opportunities for hands on experiences, learning from industry gurus, and networking with your visual thinking peers. We'll be bringing a few of your favorite facilitators from San Francisco with all new content, plus a whole lot of new facilitators from Europe.
The great guys at VizThink have created a discount code for readers of Cool Infographics.  Use the code BCRK01 when you register to get €50 ($75-$80 in U.S. dollars these days) off any regular attendance fee (not student, Government or non-profit rates).

If you can get to Berlin (and I have a lot of readers from Europe), you would really get a lot from attending.

Big thanks to the guys at VizThink!

Tuesday
Apr222008

One Day Poem Pavilion


Sort of crossing the line between infographics and art. A very cool project called the One Day Poem, from Experimental Typography. The geodesic structure is aligned to the sun, and perforated in a very specific pattern to show different parts of the poem over the course of a day, and even a different poem at different times of the year.

The specific arrangements of the perforations reveal different poems according to the solar calendar: a theme of new-life during the summer solstice. During summer solstice, the poem will contain the theme of “new life”. During winter solstice, the poem will be on “reflection and the passing of time.”
Found on digg.com

Monday
Apr142008

Treemaps for drive space

I don't think I've posted much about specific software programs, but there are a number of infographic programs that anyone can use. These two are programs that analyze what's on your hard drive, and show it you in a treemap display.

The one above is Disk Inventory X for the Mac (which I use), and the one below is WinDirStat for Windows. Both are free, and are real-life examples of how you can use infographics in your life. So take a minute, and clean off some of that old junk taking up space on your hard drive.

Friday
Mar282008

17 Ways to Visualize Twitter


Also from FlowingData.com, this post about the many ways to visualize the Twitter universe is really cool. Twitter has really been gaining some momentum lately, but I keep looking for better ways to follow the posts.

Thursday
Jan102008

Digg These Pics


Really cool new feature over on Digg.com. Back in late 2007, they added an Images category so users could digg their favorite pictures. Now they've added an interactive image viewer in the Digg Labs that lets you see new images and pictures being dugg in real-time.

The only thing I don't like is that it doesn't let you add any search terms. You have to see all of the activity, and can't narrow it down it all.

Sunday
Dec022007

Disneyland Wait Time


Traveling in California this last week kept me from being able to post. But here's a real-life infographic from Disneyland in Anaheim, CA. At the entrance to each separate attraction, is a posted wait time estimate, but they are all combined on this information board in the center of the park.

Not willing to wait an hour for the new Finding Nemo Submarine Voyage? Pick a handful of other rides that you can get through in the same amount of time and maximize the money you spent getting into the park.

Thursday
Nov082007

Flight Explorer Snapshot


Reader submission (thanks Karen).

On the NATCA (National Air Traffic Controllers Association) website is this U.S. map showing every airline flight currently in the air. The information is delayed by 5 minutes. Also, the graphic isn't interactive, so you can see any information about the dots (like which flight it is).


You can also zoom into nine select cities to see the flights in the air and the flight numbers. So the next time you're lying in the grass with your kids (in one of the major cities) looking up at the sky, you could (if you wanted to) figure out where that airplane is going.

See also: Flight Patterns