About
Randy Krum
President of InfoNewt.
Data Visualization and Infographic Design

Infographic Design

Infographics Design | Presentations
Consulting | Data Visualizations

DFW DataViz Meetup

Join the DFW Data Visualization and Infographics Meetup Group if you're in the Dallas/Fort Worth area!

Search the Cool Infographics site

Custom Search

Subscriptions:


Feedburner

The Cool Infographics® Gallery:

How to add the
Cool Infographics button to your:

Cool Infographics iOS icon

- iPhone
- iPad
- iPod Touch


Read on Flipboard for iPad and iPhone

Featured in the Tech & Science category

Flipboard icon

Twitter Feed
From the Bookstore

Caffeine Poster

The Caffeine Poster infographic

Entries in colors (11)

Friday
May262017

The Colors of Mister Rogers' Cardigans

Every Color Of Cardigan Mister Rogers Wore infographic

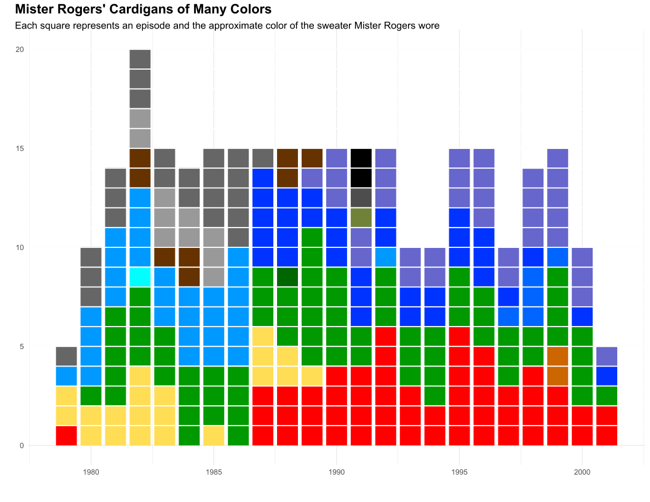
Owen Phillips was recently transfixed watching a Mister Rogers' Neighborhood marathon, and after finding the data, visualized Every Color Of Cardigan Mister Rogers Wore From 1979–2001 for The Awl.

From Owen:

For the past few days I’ve been transfixed by the “Mister Rogers’ Neighborhood” marathon that began on Monday afternoon over on Twitch. Like watching the “Joy of Painting” with Bob Ross, zoning out to “Mister Rogers” is an exercise in escapism. After Rogers helped reset my brain I began to wonder about all the handsome, colorful sweaters he famously wore. Did Rogers have a favorite?

Fortunately, Tim Lybarger, a 40 year-old high school counselor from just outside of Champaign-Urbana, Illinois, wondered the same thing a few years ago. Back in 2011, on his blog devoted to all things Mister Rogers, neighborhoodarchive.com, Lybarger recorded the color of every sweater Rogers wore in each episode between 1979 and 2001. “When I realized such a resource didn’t exist,” Lybarger told me over email, “I just felt like somebody needed to do it…might as well be me.”

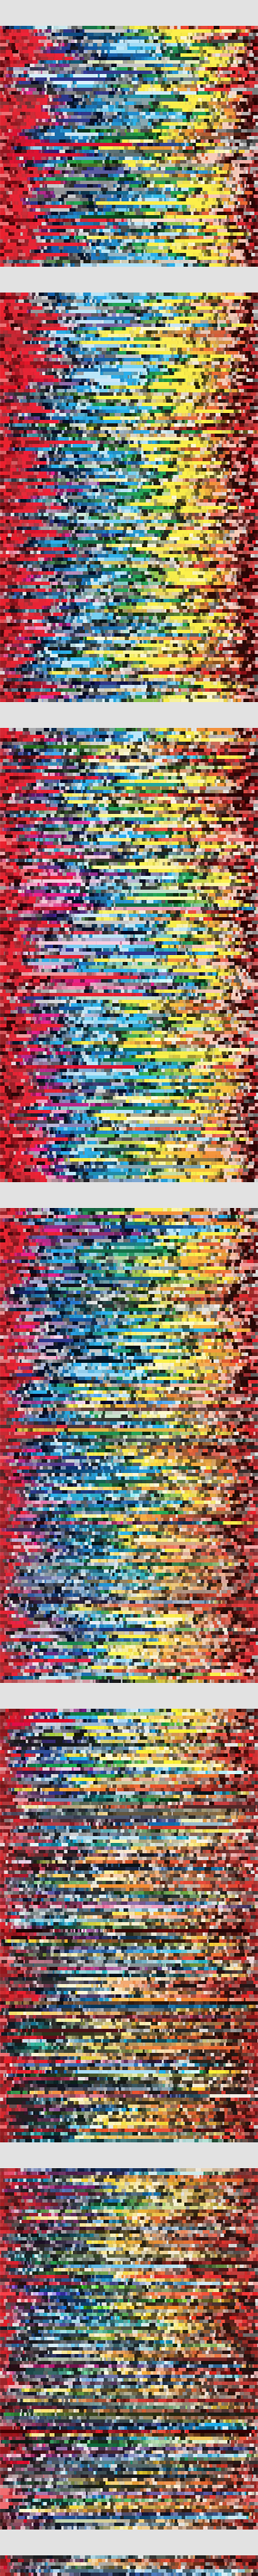
The chart above uses the data Lybarger meticulously collected to show how Rogers’ preferences for the color of his cardigan changed over time.

Every Color Of Cardigan Mister Rogers Wore Linear

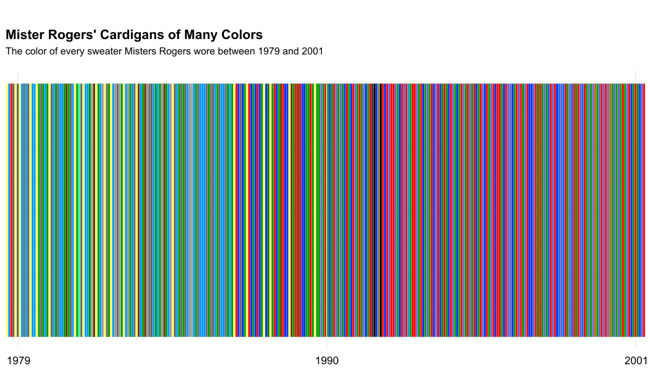
When Owen organized them in a linear order, he found that color trends definitely appears. Later years had many more darker colors.

Found on FlowingData

Wednesday
Jan042017

2016 The Year In Colour

The Year in Colour Brand Union Infographic

The Year In Colour from Brand Union looks back at 2016 and the dominant colors from the news stories every day of the year.

This year, we chose to depart from traditional season’s greetings (elves toiling in grottoes) in favour of something equally fantastical: an algorithm. We scanned the news media and identified dominant colours from leading headlines for each day of 2016.

However, it is important to note that no matter how far AI has come, it cannot replace human sentiments. Sentiments like wishing you Happy Holidays and our warmest wishes for a delightful New Year. This, we are happy to do in the traditional way: from the heart.

The design is interactive. Each dot will show you the dominant news story of the day when you hover over it, and clicking takes you directly to the article and the images used to determine the colors.

I'm not sure why the rows are 14 dots across; 2-weeks of days. This would have been a little easier to navigate if it matched the 7-day row layout of a standard calendar. Instead, the months are separated, but the dots are just shown as sequential days.

Thanks to Brianna for sending in the link!

Monday
Sep212015

The Art of Color Coordination

The Art of Color Coordination infographic

The Art of Color Coordination infographic from Kissmetrics is a lesson on how to use the color wheel when picking colors to combine. The infographic introduces you to a variety of harmonies and schemes that you can use to your advantage.

Colors affect us in countless ways - mentally and physically, consciously and subconsciously.

Psychologists have suggested that color impression can account for 60% of the acceptance or rejection of a product or service. A bad color combination can have the same negative effect as poor copy and slow load times. In this infographic, we will briefly discuss color coordination and how you can use this to your advantage when designing your site. Special thanks to @speckboy, @smashingmag and @onextrapixel.

Great intro to choosing colors for a color palette used in web design, infographics, and even presentations. I often talk about these color choice schemes in my workshops and classes.

Thanks to Ray for posting the link!

Friday
Sep112015

RGB vs CMYK

RGB vs CMYK infographic

RGB vs CMYK infographic from Card Printing explores the differences between the two color modes. Your use of the finished product determines which color mode you should choose. RGB is the best choice when it comes to digital uses, and CMYK is perfect for printed products!

CardPrinting.us presents an infographic weighing the pros and cons of using both RGB versus CMYK color codes in the printing process.

Colorful and informative in equal measures, the infographic is divided in sections detailing the identifiers, stats, arsenal, strengths, weakness, and the verdict for each spectrum. RGB (red, green, blue) is at the right side, and CYMK (cyan, magenta, yellow, black) is at the left. Graphics and text make the infographic easy enough to understand even for those who aren’t well versed in color spectrum and printing process.

Reading through the infographic can help clients and artists decide on which works best for them, especially since the arsenal section lists down the tools and media suitable for both RGB and CMYK. As well, they can get tips from the strengths and weakness sections, plus the final verdict which states that as far as the digital realm is concerned, RGB wins while CMYK is tops in print form.

Nice simple comparison that uses the side-by-side format to explain the basic differences between the color modes. Perfect to send to that manager or executive that has no idea what you're talking about!

The infographic should have visualized the stats, like the difference in the number of colors. Also the direct URL to the infographic landing page should be included in the footer.

Found on Downgraf

Tuesday
Apr282015

Avengers Comic Book Cover Colors Data Visualization

Avengers Comic Book Cover Colors Data Visualization

Jon Keegan at the Wall Street Journal has created a fascinating interactive data visualization of the last 50 Years of ‘Avengers’ Comic Book Covers Through Color

When Marvel’s “Avengers: Age of Ultron” opens in theaters next month, a familiar set of iconic colors will be splashed across movie screens world-wide: The gamma ray-induced green of the Hulk, Iron Man’s red and gold armor, and Captain America’s red, white and blue uniform.

How the Avengers look today differs significantly from their appearance in classic comic-book versions, thanks to advancements in technology and a shift to a more cinematic aesthetic. As Marvel’s characters started to appear in big-budget superhero films such as “X-Men” in 2000, the darker, muted colors of the movies began to creep into the look of the comics. Explore this shift in color palettes and browse more than 50 years of “Avengers” cover artwork below. Read more about this shift in color.

Each cover illustration is broken down into its own color band that displays the amount of each color used.

The data visualization is a fantastic display of how the color use has changed over the last 50 years. The left column has the full waterfall of colors, and the center column displays the color breakdown of each specific color. You can see each cover illustration by hovering over any specific color band.

Here’s the whole 50+ years in the full color waterfall. I can see the overall trend has moved to darker colors and more black in the cover illustrations.


Thursday
Oct022014

Online Sales Trends - Color Matters

Online Sales Trends- Color Matters infographic

Apparently your product’s color could be hindering it’s ability to be sold! Online Sales Trends - Color Matters from Stitch Labs has released an infographic describing the trendiest product colors.

Managing inventory well can be the difference between success and failure. As you look to increase profit, seemingly insignificant manufacturing and purchasing decisions are often overlooked. Using product-level data lets you prevent lost sales and excess inventory by making data-driven decisions.

A good analysis using their own internal sales data gathered from online orders synced in the Stitch system for shopping carts and marketplaces.

The 3D stacks of bills are hard to compare. 3D bar charts always have this problem of reducing the ability for readers to see the specific differences. The footer should include the URL link back to the infographics landing page so readers can find the full-size original version. Most people that share infographics don’t link back to the original, and you shouldn’t make viewers search your site.

Tuesday
Sep162014

Beer Colors

Beer Colors Cans Visualization Infographic

Beer colors is a fun design idea that combines packaging design with beer label design, these beer label designs imitate Pantone® color chips.  Maybe more of a data visualization of colors than a true infographic, but I love it!

Concept and design based on the color of the beer. Each type of beer is associated with its corresponding Pantone color. The typeface chosen is HipstelveticaFontFamily in its bold version by José Gomes, thanks for sharing.

Designed by Spanish creative agency Txaber, this series of beer packaging labels show each brew type represented by its corresponding official color. 

Beer Colors Bottles Visualization Infographic

Found on creativebloq and BoingBoing


Monday
Jan132014

What Does the Colour of Your Car Say About You?

What Does the Colour of Your Car Say About You? infographic

If you think picking a car color was hard before, this infographic could make your decision easier or even harder. The What Does the Colour of Your Car Say About You? infographic published by Motor Click gives meaning to your choice in car color.

The wide variety of colors available has some questioning whether consumers make their selection based on simple preference, or whether or not the color of their vehicle somehow reflects their psychology. Whatever the reason, it cannot be denied that color plays a huge role in sales.

This is a good infographic design that takes information from the following text-only article and makes it visual: The Psychology Behind the Color of Your Car.  This design tells one story really well, and only takes a few seconds for the reader to understand.  Designed by Attwood Digital.

A couple issues with this design.  Obviously from a car company in the UK, the spelling of color/colour is oddly mixed throughout the design.  Also the data is a little bit questionable.  The article referenced isn’t the original source of information, and that article includes claims and quotes from additional sources.  Definitely take this information with a grain of salt.  There may be underlying credibility issues.

The footer should include the URL link back to the infographic landing page so the audience can find the original full-size version when they come across it shared on other sites.  For example, it’s had over 5,000 views on the Visual.ly site so far, but that submission does not link back to the original on the MotorClick site. So, all of that good traffic to view the infographic is not benefitting the original publisher at all.

Found on Visual.ly

Monday
Oct072013

The Color Emotion Guide

The Color Emotion Guide infographic

The Color Emotion Guide arranges well known company logos into a rainbow of emotion to help readers understand which logos are using color to create a perception of their brands.

Logo designers have several puzzles to solve when presented with a new logo design project. One of the main considerations that a designer must deal with is to understand what it is that the client wants to achieve with the logo design.

The designer asks the client a series of questions that illicit answers helping to bring the parts of the puzzle together. A typical question might be “What qualities does your business want to be known for?” The answer might be for a doctor for instance, “I want to be known as someone you can trust”. So the question and answer begs: How does the designer portray trust in the logo design?

Scientists have been studying the way we react to colors for many years.  Certain colors make us feel a certain way about something. As long as the designer knows what these colors and emotions are, the designer can use that information to help present the business in the right way. These are not hard and fast rules but smart designers use the information to their clients advantage.

This fun infographic lays out the emotions and qualities that well known brands like to be known for. The color psychology is only one part of the puzzle but I think you will agree it is a very important part of it.

As far as I can tell, this appears to be a design from The Logo Company, but it was very hard to track down.  Infographics are usually shared without the accompanying articles, so designs need to include basic information like their own company logo, a copyright statement and the URL back to the original design in the actual image file.

Found on Laughing Squid

Thursday
Sep192013

A Visual Guide to What Colors Communicate

The Essential Guide to What Colors Communicate infographic

When you are designing your blog or website, how do you decide what colors to use? Your choice will make a difference on how others receive and interpret your content. Dustin Stout from dustn.tv has created Color Sets the Tone: A Visual Guide to What Colors Communicate infographic to educate website builders and bloggers on how to communicate to their readers with color.

Did you know that colors communicate? The use of color in your blog design can be an essential part of how your personal brand is perceived. Color usage can either make or break your blog design, and I will show you how to choose your colors wisely by understanding what they communicate.

When new visitors land on your blog, the first things they interpret are colors. Before they read a single character, their brain is registering colors which are subconsciously (or consciously) tied to emotions, states of mind, or [preconceived ideas]. If you do a poor job at putting together the colors in your blog design, it can be detrimental to the growth of your brand.

I’ve come up with an essential guide to what colors communicate, as well as a quick infographic to reference that is free to download! 

Simple design that tells one story really well.  Quick and easy for readers to digest, and the text associated with each color is really short.  Less text is better for infographics.

The footer should include the URL back to the landing page to make it easier for readers to find the full-size original version.

Found on http://dustn.tv/what-colors-communicate/