About
Randy Krum
President of InfoNewt.
Data Visualization and Infographic Design

Infographic Design

Infographics Design | Presentations
Consulting | Data Visualizations

DFW DataViz Meetup

Join the DFW Data Visualization and Infographics Meetup Group if you're in the Dallas/Fort Worth area!

Search the Cool Infographics site

Custom Search

Subscriptions:


Feedburner

The Cool Infographics® Gallery:

How to add the
Cool Infographics button to your:

Cool Infographics iOS icon

- iPhone
- iPad
- iPod Touch


Read on Flipboard for iPad and iPhone

Featured in the Tech & Science category

Flipboard icon

Twitter Feed
From the Bookstore

Caffeine Poster

The Caffeine Poster infographic

Entries in Amazon (4)

Monday
Nov172014

Interesting Things to Know About Amazon

Interesting Things to Know About Amazon infographic from TechieSense shares a whole bunch of facts and history about Amazon’s business, e employees and customers.

This is a really long infographic that is not a quick and easy read. This is an exhaustive guide to all of the stats about Amazon they could get their hands on. Personally, I would have suggested to break this up into multiple, shorter infographics.

I like the various data visualization methods that help the readers visually understand they have moved from one section to the next. Any stats that are not visualized and shown in text-only are perceived as secondary information, and are likely to be skipped over. Good use of logos from different departments in Amazon and other websites and companies.

Interesting social media tactic is that the infographic landing page highlights eight facts from the infographic and lists that in text as suggested tweets with custom Tweet This links.

Found on Parampreet’s Google+

Wednesday
Mar052014

Hungry Tech Giants

Hungry Tech Giants Interactive Infographic

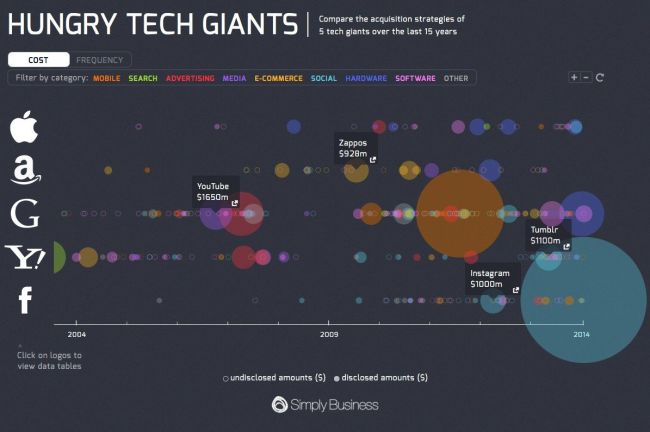
Hungry Tech Giants is a cool infographic from Simply Business that is both zoomable and interactive!  To put them into context, the design visualizes 15 years of tech company acquisitions by Apple, Google, Yahoo, Amazon, And Facebook.

2013 was a busy year for tech acquisitions.

With competition in the tech space heating up, Apple, Amazon, Google, Yahoo, and Facebook collectively executed 65 acquisitions in 2013 alone.

Yahoo was the biggest acquirer of 2013, buying a total of 25 companies following the hiring of its new CEO, Marissa Meyer.

Although Meyer is best known for her acquisition of Tumblr, the majority of her deals have bought engineering talent in an effort to build Yahoo as a serious challenger to Google.

Apple also had their biggest ever year for acquisitions in 2013, with ten purchases in total.

To see all of the acquisitions in detail, please visit our interactive microsite.

Each acquisition is appropriately placed on the timeline, and shown as a circle sized to match the total acquisition price.  Solid circles shown known prices, and open circles are not sized because the acquisition amount was never released publicly.  The circles are also color-coded to represent the different categories.

The interactivity allows you to select which categories to show, and when you hover over any particular acquisition, the acquired company name is shown with a link to the press release or news story announcing the acquisition.

The zooming controls allow you to adjust the date range shown, which helps identify many of the overlapping circles.  Clicking on the company logos on the left also brings up the data table which shows all of the known values, dates and includes the links to the press releases.  A very good way to establish credibility and make your data sources transparent.

The overall design is meant to be very detailed and allow the audience to dig in and explore the data.  At the macro level, the infographic clearly puts Facebook’s $19B acquisition of WhatsApp into context as the largest tech acquisition of all time!

Found on TechCrunch and Cult of Mac!

Saturday
Nov302013

Cool Infographics 30% Off at Amazon This Weekend ONLY!

Cool Infographics 30% Off at Amazon This Weekend ONLY!

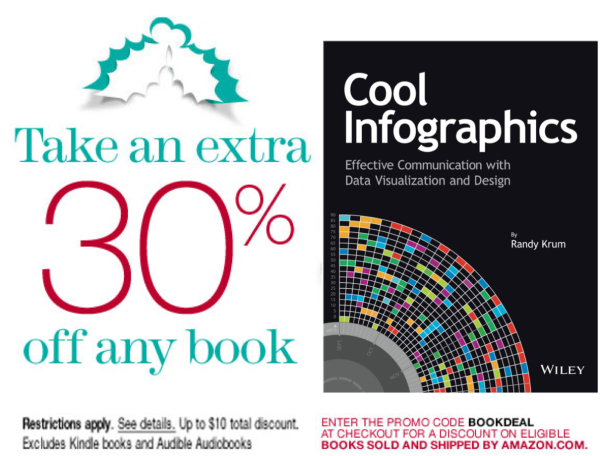
This weekend ONLY, Amazon is offering 30% Off any one print book, and you can use this deal to get Cool Infographics at the lowest price yet!  The deal ends December 1st at 11:59pm PST.  Use the promo code “BOOKDEAL“ at checkout under the “Gift cards & promotional codes” section.

You can read the details and Terms & Conditions here.

When I looked on Saturday, Amazon’s retail price was listed at $25.08 (it changes daily), and with this discount you could get Cool Infographics for only $17.56.  That’s the lowest price I’ve seen anywhere!

Friday
Jan252013

Philippe Dubost's Amaz'ing Resume

Philippe Dubost's Amaz'ing Resume

Very cool!  You have to check out Philippe Dubost’s (phildub) resume site.  Completely designed to emulate an Amazon product page, down to the smallest details.  Many of the links work nicely, taking you to a contact form or details on his LinkedIN profile page.  Things like his Product Dimensions, Only 1 Available, Star ratings and frustration-free packaging from France.  Even a Google Ad, similar to the ads on actual Amazon pages.

Certainly creative, I wondered if this should be considered an infographic resume.  I ended up convincing myself that “Yes” I do consider it to be infographic because it visualizes Philippe’s information in a way that is recognizable and easier to read and understand to the audience.  Star Ratings, key features, product photos and recommendations.  The visuals do bring meaning to the information, even though it’s done in a fun and amusing way.  It doesn’t have to be a chart of numerical data to be infographic.

What do you think?