About
Randy Krum
President of InfoNewt.
Data Visualization and Infographic Design

Infographic Design

Infographics Design | Presentations
Consulting | Data Visualizations

DFW DataViz Meetup

Join the DFW Data Visualization and Infographics Meetup Group if you're in the Dallas/Fort Worth area!

Search the Cool Infographics site

Custom Search

Subscriptions:


Feedburner

The Cool Infographics® Gallery:

How to add the
Cool Infographics button to your:

Cool Infographics iOS icon

- iPhone
- iPad
- iPod Touch


Read on Flipboard for iPad and iPhone

Featured in the Tech & Science category

Flipboard icon

Twitter Feed
From the Bookstore

Caffeine Poster

The Caffeine Poster infographic

Entries in resume (9)

Monday
May152017

Elon Musk's Resume of Failures

Elon Musk's Resume of Failures infographic

It's very common for super successful people to have their fair share of failures along the way. But Elon Musk has an astonishing amount of failures that has led to his massive success! In fact, so many that Kickresume has created a resume out of them. The Elon Musk's Resume of Failures highlights his major negative business and personal moments in his adult life. Probably more of a timeline than a resume.

Failure is frustrating. Failure is something you don’t put on your resume. On the contrary! One does not simply write a resume of his or her failures (Hint: we’re going to do it). At the same time, if you attempt great things, your failures are probably going to be just as impressive as your accomplishments.

There’s probably no other person alive today who embodies this notion more than Elon Musk.

Sure, he’s considered a genius who also happens to be worth $14 billion.Certainly, many of his ideas have turned into realities. Arguably, he revolutionised every industry he has ever touched: eCommerce (PayPal), automotive industry (Tesla), space flights (SpaceX), and sustainable energy (SolarCity). Still, all of these accomplishments pale in comparison to his ability to fail.

Read more at https://blog.kickresume.com

Thanks to Tomas for sending in the link!

Friday
May272016

The Infographic Resume by Hannah Morgan: Interview & Giveaway

The Infographic Resume is a fabulous book by Hannah Morgan from Career Sherpa! I have a chapter dedicated to infographic resumes in my book, Cool Infographics, but this is the only entire book I've seen dedicated to infographic resumes anywhere. Find more on Hannah's book page.

This month I am giving away one signed copy of The Infographic Resume! Register on the Giveaways Page by June 30th to be entered.

Infographic resumes are in, and they’re not just for designers. Free online tools are popping up every day to help anyone create a dynamic, visual resume—adding panache without sacrificing substance for style.

The Infographic Resume provides essential tips and ideas for how to create visual resumes and portfolios that will make you stand out from the crowd. Richly illustrated in full color and including lots of inspiring examples, the book will teach you how to:

  • Create a powerful digital presence and develop the right digital content for your goals
  • Build your self-brand and manage your online reputation
  • Showcase your best work online
  • Grab a hiring manager’s attention in seconds

Packed with dynamic infographics, visual resumes, and other creative digital portfolios, The Infographic Resume reveals the most effective tools, eye-catching strategies, and best practices to position yourself for any job in any kind of business.

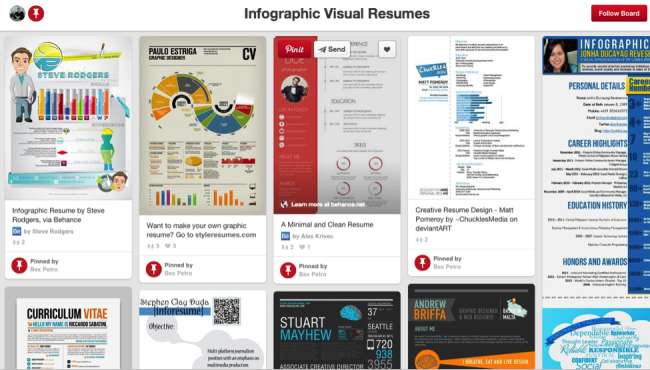
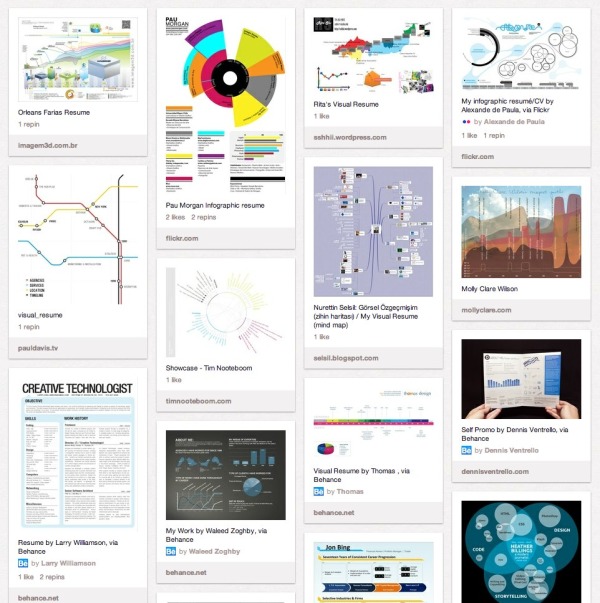
Everyone should follow Hannah Morgan on Twitter (@careersherpa)! She shares her wisdom and insights on resumes, hiring and career issues openly. You can download her Infographic Resume Cheat Sheet, and she maintains a Pinterest Board gallery of Infographic and Visual Resumes.


Hannah answered a handful of questions about The Infographic Resume:

How would you define an infographic resume?

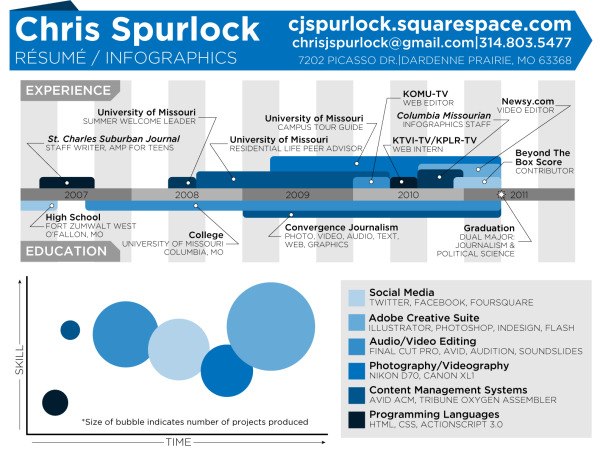
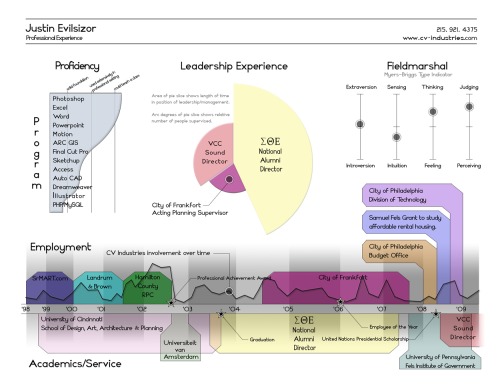
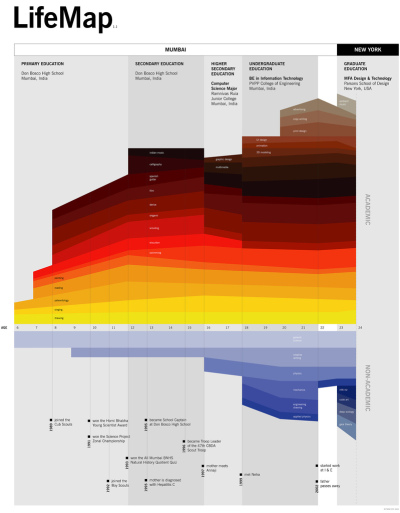
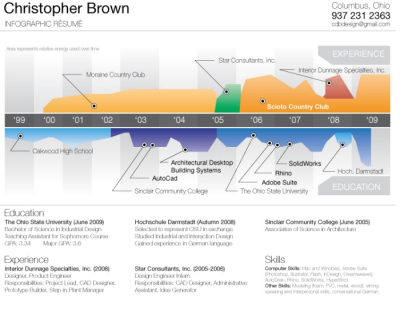
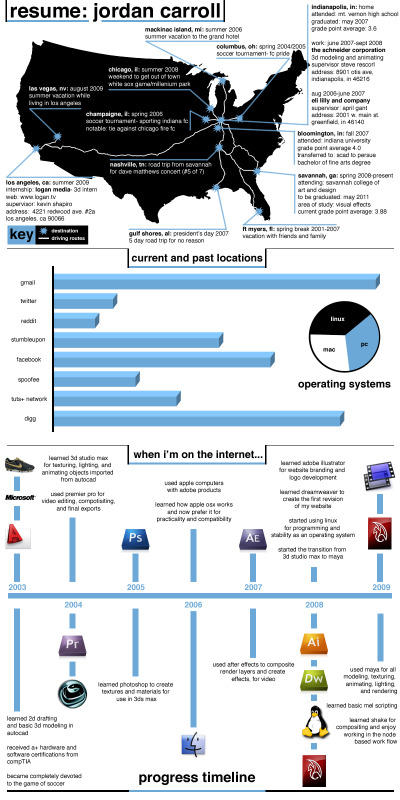
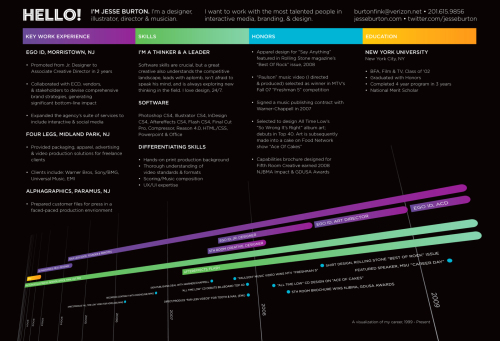
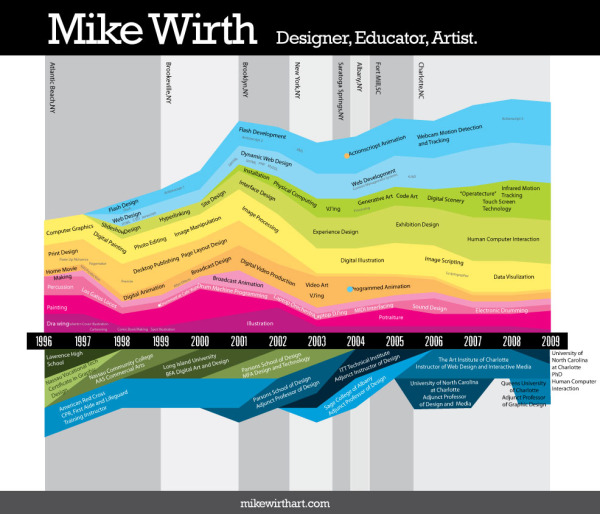
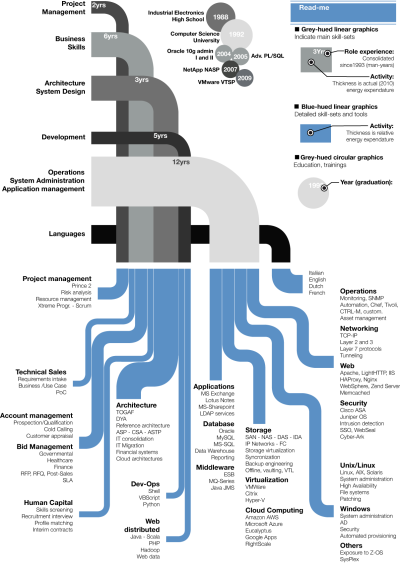
Hannah: An infographic resume converts your work experience into visual pieces such as charts and graphs. Instead of finding the right words to write about your skills and achievements, you can present the most important parts of your experience visually. While this may sound difficult for some people, especially those without design skills, it can actually be liberating. As the saying goes, a picture is worth a thousand words.

Chapter 1 was great! Could you summarize your chapter on How We Got Where We Are Today?

Hannah: You may have noticed infographics and other visual elements appearing more often in newspapers, marketing materials and social media than in the past. We are inundated with information and rely on our smart phones for on-the-go access. Reading large blocks of text takes time and it is even more difficult to read on a mobile device. Studies indicate that the brain processes pictures faster than words. Other studies say pictures increase comprehension, increase the time people spend on a website, and increase sharing of updates on social media. Job seekers can leverage these trends to their advantage. Savvy job seekers know today’s job market is highly competitive. To make matters worse, almost every company has an Applicant Tracking System (ATS) which typically weeds out candidates and results in the dreaded “black hole” of no response. Technology has enabled job seekers to break out of the standard “apply online and wait” mold. By applying out-of-the-box marketing strategies such as social media campaigns, personal websites and infographic resumes, job seekers can do more to stand out and garner the attention they crave (and deserve). 

How would you describe the current state of the market for infographic resumes?

Hannah: Infographic resumes deviate from the expected and that is the very reason to use one. Most job seekers will not use one either because they don’t know about them, don’t know how to create on or think it would be risky to try and use one. In my opinion, the rewards outweigh the risk. Go ahead, use an infographic resume.

What are some of the more unexpected jobs or careers that you have seen candidates use an infographic resume?

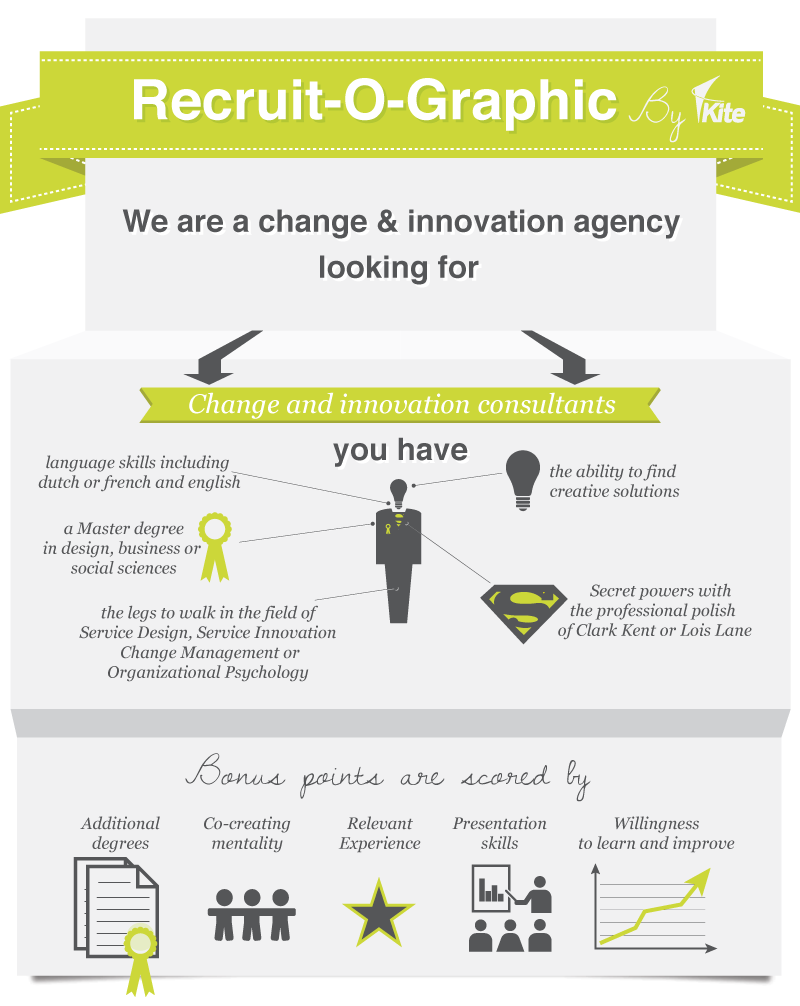
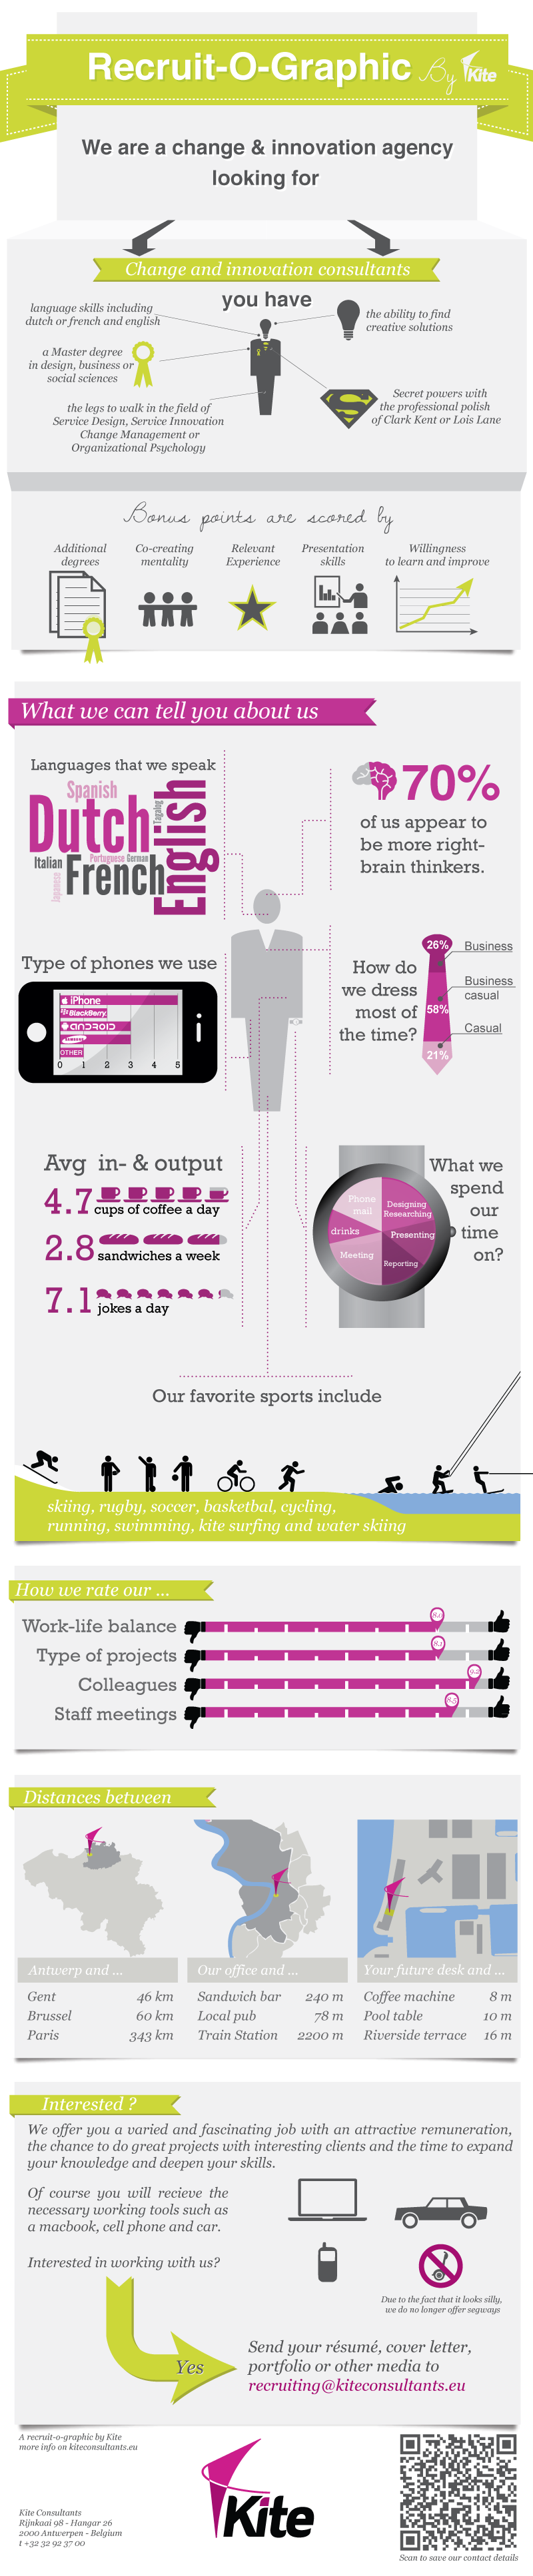
Hannah: The early adopters of infographic resumes were people who had graphic design skills. But infographic resumes are being created by technical writers, sales representatives, information technology specialists and many other types of occupations. Infographic resumes demonstrate creativity and innovative thinking which are qualities valued in marketing departments, information technology, and start-up organizations, just to name a few. Consider the culture of the organization and the requirements of the role to help determine if an infographic resume might be successful opening doors.

Are there any risks associated with infographic resumes?

Hannah: There are some things you should know before you use an infographic resume. First, and foremost, do not use infographic resumes when submitting through applicant tracking systems! The technology used in ATSs cannot read visual content. You should also take into consideration who you are sending your infographic resume to. Typically, people in human resource and recruiting roles expect to see the traditional, conservative text resume. These roles often have to review hundreds, if not thousands, of resumes and do not have time to search your infographic for skills and work history. A better strategy is to send your infographic resume to the actual hiring manager or to a contact you have made inside the organization. Infographic resumes also make a great addition to your LinkedIn profile as embedded media in the summary section. If you have a personal website or online portfolio, an infographic resume works well there too. If you are proactively networking with people in your field of interest, bring your infographic resume to the meeting and share it to guide the conversation. And why not bring an infographic resume to an interview to impress the interviewers?

What types of reactions to infographic resumes are you hearing from hiring managers and recruiters?

Hannah:  About a year ago, I polled the recruiters, human resource professionals and career coaches in my network to get their feedback on infographic resumes and the overwhelming response was positive. In fact, 68 percent said they would look at an infographic resume, 32 percent said it would depend and no one said that they wouldn’t look at one. Here are some of the comments I received: 

“I would welcome a fresh, newer idea, which this is, as opposed to the same old resume.” -Hiring Manager

“Shows some creativity.”  -Other

“Yes! I would be thrilled with the creativity, and it would definitely be a resume that would stand out from the pack.” – Hiring Manager

“Yes, because normal resumes are boring.” -Other

Do you have your own infographic resume that I could share?

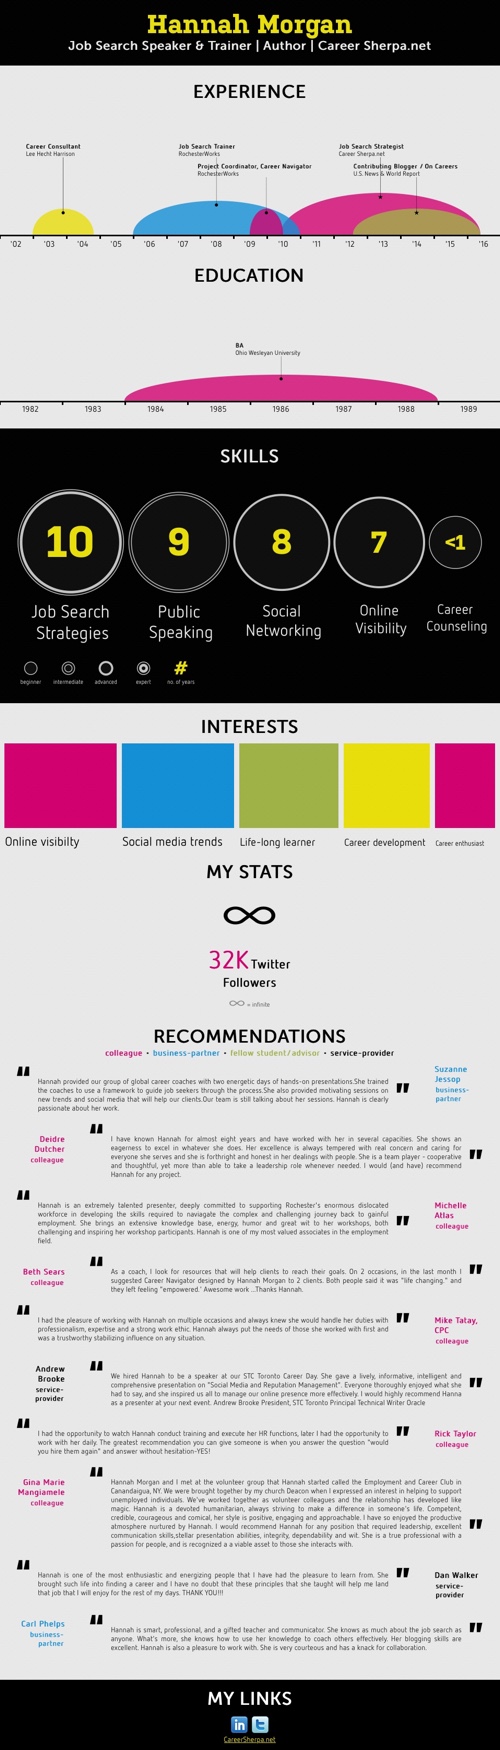
Hannah: Since I don’t have design skills, I rely on tools that convert my LinkedIn profile into an infographic resume, like this one created using vizualize.me. There are so many tools available to help create infographics so even people without design skills or familiarity with design software can dabble in infographics. I’ve written about four of those tools here: http://careersherpa.net/4-templates-for-infographic-resumes/


Hannah's Bio:

Hannah Morgan is the Founder, CareerSherpa.net and a Job Search Strategist. She is a speaker and author on  job search and social media strategies. She delivers fresh advice and serves as a guide to the treacherous terrain of today’s workplace landscape. Hannah’s experience in Human Resources, Outplacement Services, Workforce Development and Career Services equip her with a 360 degree perspective on job search topics. Recognized by media and career professionals, Hannah is an advocate who encourages job seekers to take control of their job search. Hannah is frequently quoted in local and national publications and she writes a weekly column for U.S. News & World Report.

Hannah is the author of “The Infographic Resume” (McGraw Hill Education, 2014) and co-author of “Social Networking for Business Success” (Learning Express, 2013). You can learn more about Hannah on CareerSherpa.net and by following her on Twitter at @careersherpa.

Monday
Dec222014

5 Ways to Market Yourself Visually

Visuals communicate complex ideas into something more digestible. Large amounts of text make it harder for our brains to find pertinent information in a timely manner. This problem can be remedied quite easily, by adding images and visuals into marketing yourself.

Visuals can help turn a complex idea into something more easily digestible, with less effort and time spent by the person viewing it. By putting extra work in on your end, you position yourself to leave a more lasting impression, and stand out from a pile of resumes. Especially when marketing yourself to a recruiter or HR department - making it easier for them to understand your most important work. In Cool Infographics, I cover how visuals are 6.5 times more likely to be remembered than text alone, and there’s no better time to be remembered than when you’re applying for a new job.

Below are five ways to start marketing yourself visually right away:

1. The Infographic Resume

Infographic Resumes Pinterest BoardPinterest Board Gallery of over 900 Infographic Resumes

Infographics are an excellent visual tool to have in your arsenal. They are the pinnacle of displaying complex information in an easily digestible way. Either pay a talented infographic designer, or do one yourself. If you’re not comfortable using graphics design software, check out an excellent free option online like Visme.co - that will have you designing infographics in no time.

Take a look at this Infographic Resume Pinterest Board with over 900 examples for inspiration, and check out the great book The Infographic Resume by Hannah Morgan when you’re ready to get serious about developing your own.


2. Visualize Your LinkedIn Profile

via Richard Branson’s LinkedIn profile

It should be no big surprise that a prospective employer will look at your LinkedIn profile prior to checking you out in person. LinkedIn allows you to add photos and visually rich imagery, so take advantage of these opportunities. If you add companies that Linkedin recognizes to your work history, your profile will automatically display their logos.

Examples could be photos of you working at a trade show, product prototypes you designed, or a photo of you giving a presentation (LinkedIn has Sl SlideShare integration, so embed the presentation in your profile as well). Other images or PDF files work as well, like an advertisement you designed.


3. Create A Visual Portfolio of Your Work


Talking about your creative work only goes so far, you need to provide visuals. Visuals help the employer see what you’re capable of, and gives you the opportunity to control the work they see. Websites like Behance and Dribble are excellent options for creatives of all types. Not only do you get to upload all of your projects, but you get to interact with their creative communities as well - having the chance to inspire others, and be inspired yourself.


4. Create a Blog Post to Provide More Information and Visuals of Your Work


A resume should be a brief overview of skills, previous employment, education, and best works. One page is best. If you would like to expound further upon your projects, then create a blog post - loaded with visuals - that delves deeper into your work.  Tumblr is a great free option for keeping a personal blog.

Include links to any additional content you publish in your Linkedin profile and even on your text resume. Make it as easy as possible for hiring managers and recruiters to find your work.


5. Content Curation

Similar to the idea of creating a blog post to highlight your best work, create a content curation site to highlight the best infographics, articles, quotes, YouTube videos, podcasts, brands, inspirational work, thought leaders, TED talks, and books you’re reading. Show your future employer that you have a passion for gaining knowledge, and are an expert in your field. Pinterest is a great option, and if you’re looking for a design-centric curation site, Designspiration has got you covered.


What other ideas would you recommend?

Monday
Nov182013

17 LinkedIn Profile Must-Haves

17 LinkedIn Profile Must-Haves is a how-to infographic that walks the reader through optimizing their LinkedIn profile page.  Published by MarketMeSuite working with Maximize Social Business.com’s Neal Schaffer.

This year has been a big one for LinkedIn. With new features like the Creative Portfolio Display, you now have the ability to visually showcase your professional portfolio. But before diving any deeper with the latest add-ons, does your LinkedIn profile have all the elements that will help you rise to the top? This new infographic has all the tips you need to elevate your LinkedIn profile: 17 LinkedIn Profile Must-Haves!  Everyone can use great tips, so please share the LinkedIn love!

Great design using a mock LinkedIn profile as the background.  The callouts are clearly connected to the appropriate areas on the profile.  There’s a lot of text, but in this case I think most of it is necessary to clearly explain each point.  The reader can work off of this infographic without any additional research on other sites.

The statistics at the bottom should have been better visualized.  Mixing the 50.5% stat with the profile complete percentage visual from LinkedIn is confusing.  Also, it was difficult for me to find the original infographic landing page.  The footer should have the URL for readers to find the full-size original version of the infographic.  The source list text is too small to read too.

Thanks to Martin Mosler for post on Google+!

Friday
Jan252013

Philippe Dubost's Amaz'ing Resume

Philippe Dubost's Amaz'ing Resume

Very cool!  You have to check out Philippe Dubost’s (phildub) resume site.  Completely designed to emulate an Amazon product page, down to the smallest details.  Many of the links work nicely, taking you to a contact form or details on his LinkedIN profile page.  Things like his Product Dimensions, Only 1 Available, Star ratings and frustration-free packaging from France.  Even a Google Ad, similar to the ads on actual Amazon pages.

Certainly creative, I wondered if this should be considered an infographic resume.  I ended up convincing myself that “Yes” I do consider it to be infographic because it visualizes Philippe’s information in a way that is recognizable and easier to read and understand to the audience.  Star Ratings, key features, product photos and recommendations.  The visuals do bring meaning to the information, even though it’s done in a fun and amusing way.  It doesn’t have to be a chart of numerical data to be infographic.

What do you think?

Friday
Jun152012

200+ Infographic Resumes, an escalating trend

Pinterest Board of Infographic Visual ResumesPinterest Board of Infographic Resumes

Back in January of 2010, I posted 16 Infographic Resumes, A Visual Trend that highlighted the start of the trend of infographics and data visualization moving into resumes.  Why 16?  Because that’s how many good examples I could find at the time on the Internet to showcase the concept.  Two and a half years later, that post continues to be one of the most viewed blog posts on Cool Infographics with an average of 3,500 views every month.  A 2.5 year-old blog post!

Since then, the idea of infographic visual resumes has exploded.  I have continued to gather links to infographic resumes, and my collection is now over 200 examples of infographic resumes that have been published online.  Instead of trying to post them here on the blog like I did in 2010, I’m experimenting by creating a Pinterest Board dedicated to sharing Infographic Visual Resumes.  I will continue to add resumes and grow the board, so follow the board if you want to see new ones as they are addded.  If you know of any that I should include, add the link in the comments or send a link through the Contact form with “Infographic Resume” in the Subject line. 

The Cinderella Story example is the Chris Spurlock resume shown below.  The story is that Chris was a graduating Journalism major at Missouri School of Journalism in early 2011, and created his infographic resume because he wanted to pursue data journalism as a career.  It was posted on the J-School blog, but quickly went viral on the Internet.  As a result, he was hired as an Infographic Design Editor for the Huffington Post!

Chris Spurlock infographic resume

I haven’t made any distintion between good and bad designs on the Pinterest board, because all of the designs can give you good ideas about types of data visualizations you can include in your own design.  The only distinction I have made is that they have to include some type of data visualization to be considered infographic.  There are many, many great graphic designer visual resumes that aren’t “infographic” so they aren’t included on the board.

Also, I have attempted to link each design back to the original owner’s site (like Chris’ resume above), but for many the public posting is on a portfolio site like Behance or Visual.ly.  If any of these should be linking to a different location, please send me a note through the Contact page, and I’ll get them linking to the correct places.

It’s definitely worth mentioning that there are a whole bunch of new online sites launching to capitalize on this growing trend.  The service they offer is to create an automatic infographic resume for you, usually based on your LinkedIN profile.  Vizualize.me, re.vu, Kinzaa, ResumUP and cvgram.me all create an infographic resume for you using their pre-designed templates.  I’ve tried to only include a couple examples from each service because 50 resumes based on the same template won’t provide you more inspiration to design your own.  My opinion is that these sites and templates are currently new enough to help your resume stand out, but very quickly the risk is that the templates will become recognized (like PowerPoint templates).

I’m planning a separate, future post about the best practices when designing your own infographic resume, but I wanted to shared the Pinterest Board with you as a resource for inspiration.

Please add a comment with your thoughts about the future of infographic resumes!

Tuesday
Sep062011

Recruit-O-Graphic

What a great idea!  Kite Consultants designed this infographic job posting, Recruit-O-Graphic, as an innovative way to visualize the job requirements and to show some aspects of working for Kite.  What would have been a long, wordy job posting is now fun and easy to read.  You also get a great sense of the company culture and attitude.

I’m definitely doing something like this for InfoNewt when it’s time to recruit!

Thanks to Sebastiaan for sending in the link!

Thursday
Sep232010

Client Infographic: The Good News for Online Degrees


Good News for Online Degrees is a recent project InfoNewt (my company) designed for elearners.com to visualize the results of a survey of Human Resources professionals worldwide.

The results are good, as online degrees continue to gain credibility and popularity.  Designed as a companion infographic to the article “How Employers View Online Degrees” on the elearners.com website, the visual not only supports the article, but also stands on its own for posting on blogs.

I used a blend of pie charts, bar charts, circles and images to tell a story as you move down the visual.  The different visuals help separate the different questions that were asked in the survey, but always include the actual numbers as well.  For survey results, you want to be as transparent as possible by citing the source material, repeating the questions that were asked and using specific numbers to validate your visuals.

Personally, the most interesting results are in the stacked bar chart in the middle.  Online degrees have dramatically different levels of acceptance based on what level of role the applicant is applying for.

Available as a high-resolution GIF and PDF from the elearners.com site.

Cheers to Helen and everyone at elearners.com!

Friday
Jan082010

16 Infographic Resumes, A Visual Trend

(It’s actually up to 18 now.)
A number of designers have attempted to design a visual, infographic resume, and while this is certainly not mainstream (yet), it is gaining some momentum.  I wanted to highlight some of the great examples available on the web, but the line between an infographic resume and a designer resume is tough not to cross.  I’ve tried to stay true to only infographic versions here, and didn’t include many good illustrated resumes that didn’t include any visualizations.


Michael Anderson’s 2008 concept on an infographic resume (above) is probably the most well known.  It’s been tweeted, dugg, reddit-ed and featured on FastCompany.com.

I decided to update my résumé with a different perspective on the typical time-line theme. This is just concept art, as there are almost no real metrics represented except for time. There is no energy expenditure unit of measure, nor tics to delineate percentage or otherwise.

Christopher Perkins’ resume, using the subway map metaphor.
I do agree it’s more of an overview and less of a project-experience-oriented resume, but I’ve been thinking a lot about (and looking at) resumes lately, and I feel like what you really need to do is grasp someone’s attention first. This is whyhttp://www.percious.com is listed at the top, and that’s about all listed (no address, phone number, etc.) The other thing I was thinking about doing was to add an image map with links to provide more information about the things I have worked on.


Also using the subway map metaphor, Kevin Wang plots out his activities during his school years.


Curriculum Vitae, by Uito2 in 2007, shows his experience level in different software packages as progress bars.


Chester, Lau Cheuk Hang, does a great job utilizing a timeline at the top of his resume with spanning arcs to highlight time spent in different activities.

Greg Dizzia also creates a Curriculum Vitae showing vertical bars spanning a timeline for each company, and adds an additional element of icons to represent different experiences during each project.

This lists my history in the design world (some lesser clients have been left out) - Designed using univers exclusively. This is an appendage to a traditional resume, to be included as a forward page in my portfolio.

Jonathan Kaczynski, also tries a subway map style using the different lines as categories instead of attempting a timeline.  I actually think this approach works a little bit better, the timeline versions appear difficult to translate into a subway map.

I am currently in the process of remaking my portfolio. It will have the appearance of a mass transit system’s website. This is the resumé that I’m working on to go along with the portfolio. It still needs a bit of clean-up and and logo needs some work.


Justin Evilsizor’s version incorporates a timeline, a level-of-skill chart and I personally love the addition of the Meyer’s-Briggs Type Indicator.


Arnaud Velten, Cartographer of Complexity, created this isometric resume.  At its heart is a timeline, but he has added an incredible amount of detail to each of his skills.  Seems like too much detail for me, but that may be what he wants to convey.


Maybe not technically a resume, Ritwik Dey’s Life Map is an impressive timeline of his education and activities.

This information design piece maps out my interests between ages 6 and 24 and the context in which they were born and nurtured. It also brings to surface how these interests influenced and were in turn influenced by milestones in my personal journey.


Stephen Gates’ resume is very clean a take on the timeline.

Why did no one try something new? Why wasn’t there one designer who took on their resume as design challenge to do something visual and different? I also realized that I was just as guilty as everyone else so I set out to design something different. So after some work in my spare time I have the design shown above (click on it to see it full sized). It is just a start and it feels like it is heading in an interesting direction but let me know what you think.


Bob van Vliet also created a very clean timeline resume.

I thought I’d try something different from the standard A4 with a dull summary of positions.  Four timelines represent the most important parts of my life so far: Work, Education, Activism and Fun. The years get wider towards the present as those say more about who I am now than when I just started university.


Christopher Brown’s colorful infographic timeline inspired by Michael Anderson’s concept.


Jordan Carroll’s resume includes a few different elements.  Timeline, map and charts combine into one overall resume.


Another colorful timeline resume, this one by Pruek Wiyaporn, also appears inspired by Michael Anderson’s concept.


Jesse Burton also has a very nice stylized timeline resume.


Which ones do you like?  Have I missed any other good ones out there?

Thanks to links found on VisualThinkMap, FastCompanyPatrick Debois


EDIT: Here are a few more that I missed when I originally wrote the post:


Mike Wirth is a freelance infographic designer.  His colorful timeline has experiences above the X-axis, education is below and his geographic locations are the shaded bars in the background.  When he learned specific software packages is also identified in the colored area, which shows how long he has been using the different software packages.


Gabriele Bozzi designed this resume concept that focuses totally on skills and experience.  Education is identified in the small bubbles, and the skills are connected to specific examples of her experience.  She is working on a separate timeline graphic.