About
Randy Krum
President of InfoNewt.
Data Visualization and Infographic Design

Infographic Design

Infographics Design | Presentations
Consulting | Data Visualizations

DFW DataViz Meetup

Join the DFW Data Visualization and Infographics Meetup Group if you're in the Dallas/Fort Worth area!

Search the Cool Infographics site

Custom Search

Subscriptions:


Feedburner

The Cool Infographics® Gallery:

How to add the
Cool Infographics button to your:

Cool Infographics iOS icon

- iPhone
- iPad
- iPod Touch


Read on Flipboard for iPad and iPhone

Featured in the Tech & Science category

Flipboard icon

Twitter Feed
From the Bookstore

Caffeine Poster

The Caffeine Poster infographic

Entries in laws (5)

Friday
Feb272015

Overtime Pay Laws

Call Center Employee Overtime Pay Laws infographic

The Call Center Employee Overtime Pay Laws infographic from overtimepaylaws.org is in informative design can help both employees and employers understand the rules when it comes to paying overtime.

Call centers employ thousands of workers throughout the United States. Many call center employees are required to perform tasks before a shift and after a shift that are not considered “on the clock” by their employer, such as booting up a computer or loading dialing software. This additional time spent on these tasks can give rise to an overtime pay lawsuit brought under the Fair Labor Standards Act. Our Call Center Overtime Pay Infographic Explains the important issues in these cases.

This design follows a simple story format with only a few steps:

  1. What’s the Problem?
  2. What’s the Impact?
  3. What can the Reader do?

 I love that this design simplifies the information, and doesn’t try to include too much detail.

Thursday
Jun052014

Legislative Explorer: Watch Government In Action

Legislative Explorer: Watch Government In Action

Legislative Explorer is an interactive, animated data visualization that visualizes the process of bills submitted by houses of Congress; the Senate on the left and the House of Representatives on the right.  Designed by Researchers at the University of Washington’s Center for American Politics and Public Policy, it’s a fascinating visualization that is mesmerizing to watch.

A deluge of data is challenging scientific researchers across disciplines to develop new techniques for detecting patterns in large and complex datasets. This general area of research is known as data-driven discovery, or ‘D3.’ Visualizations are a particularly important area of innovation because they help researchers to investigate complex processes at a more holistic level. The goal of Legislative Explorer is to leverage the same benefits of data-driven visualizations to advance understanding of government.

A more in-depth discussion of Legislative Explorer with multiple animations and videos is available at the Center for American Politics and Public Policy.

Anyone can use Legislative Explorer to observe large scale patterns and trends in congressional lawmaking without advanced methodological training. In addition, anyone can dive deeper into the data to further explore a pattern they’ve detected, to learn about the activities of an individual lawmaker, or to follow the progress of a specific bill. Start Exploring!

I selected the 99th Congress (1985-1986) for the screenshots, and you can see the party breakdown of both houses of Congress by their color.  Each icon represents a specific member of Congress which you can identify by hovering your mouse over the icon.  The animation will show a visual spray of bills introduced by members in both houses of Congress as party-color-coded dots that move into committees and through the steps to becoming a law.

Legislative Explorer: Watch Government In Action Zoom 

There are a number of user-definable filters to help narrow down the visualization to a specific party, only one committee, or even just to watching a single bill move through the proces.

Here’s a quick video tutorial:

Found on FlowingData

Tuesday
Feb052013

How Texas Laws Are Made

How Texas Laws Are Made infographic

Texas Co-Op Power brings us the How Texas Laws Are Made infographic outlining the process bills go through in the state legislature to become the law of the land.  Also available as a PDF for download here.

The 83rd session of the Texas Legislature—150 representatives and 31 senators—is under way. What transpires over the 140-day session that began January 8 may seem incomprehensibly complex to the average citizen. So, in the interest of keeping our co-op members informed and involved, we offer this compact guide to how a bill moves through the legislative process and reasons why communication with your legislators matters.

Designed by Mike Wirth Art with Suzanne Cooper-Guasco, Ph.D., this infographic uses a game-board design style to online all of the steps along the path.  The color-coding to differentiate the activities between the House, the Senate and the Governor is clear and easy to understand.

Thursday
Dec202012

Fire Code Regulations for Live Christmas Trees in Schools

Fire Code Regulations for Live Christmas Trees in Schools infographic

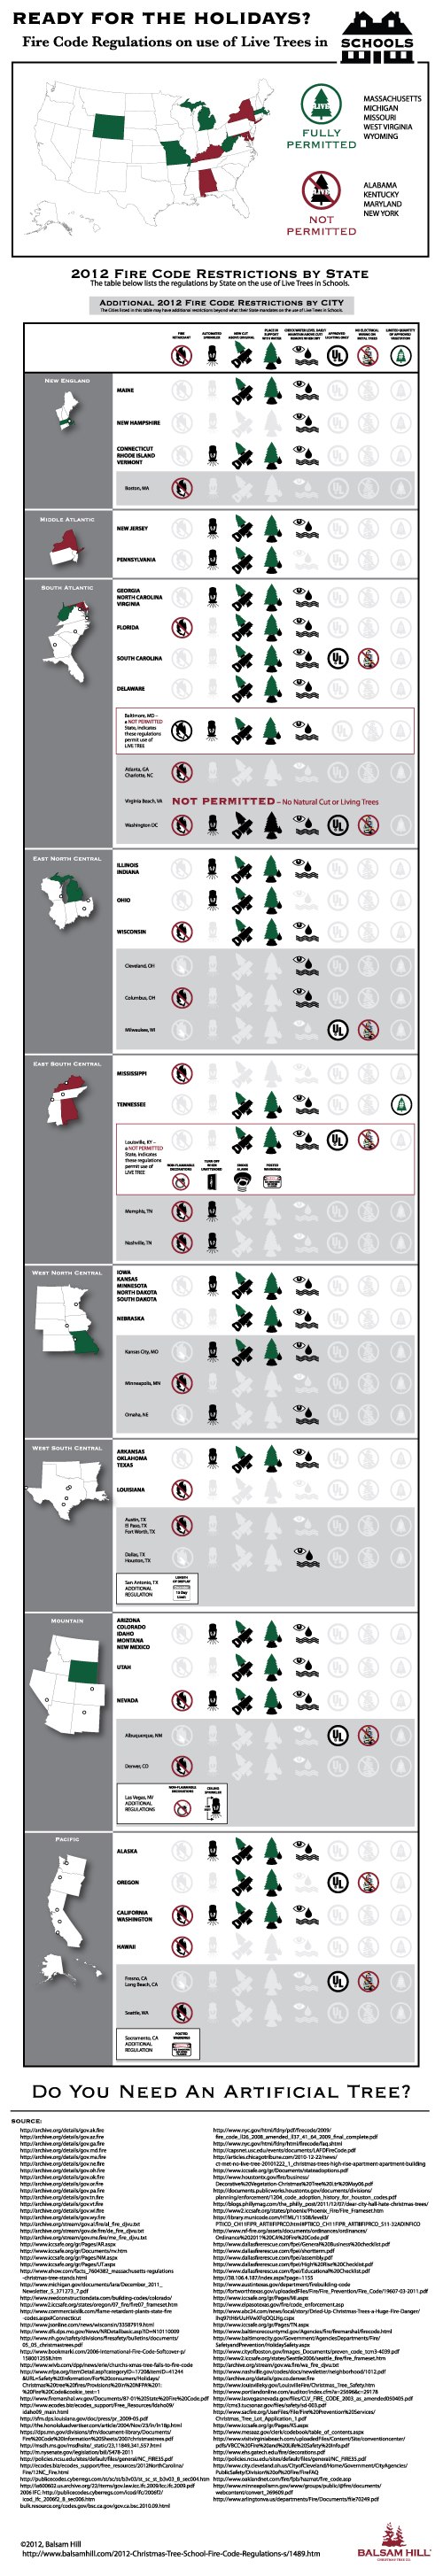
Fire Code Regulations for Live Christmas Trees in Schools is an informational infographic from the team at Balsam Hill, an online retailer for artificial Christmas trees.  This design is meant to help school officials and purchasing agents all over the country, and not really intended for the general public online.

Setting up a real Christmas tree in a school requires detailed knowledge of a state’s Christmas tree fire code. School fire code regulations for real Christmas trees vary by city and state, and can be overwhelming to puzzle out due to a confusing and sometimes conflicting set of rules. The Balsam Hill Christmas Tree Company has compiled each state’s school fire code regulations for live trees into an infographic for schools and school districts to reference. Look through the infographic to help you decide whether or not an artificial Christmas tree may be a more practical alternative for your school this holiday season.

From a marketing perspective, this design succeeds tremendously.  The overall message is clear: “Regulations around live Christmas trees in schools are complicated.  An artificial tree would be much easier.”  Balsam Hill put together a ton of research (look at the number of sources!), and even though they were able to gather the state level regulations, many cities, counties and individual school districts have their own regulations that may be contradictory.  A number of major cities with different regulations than their state are highlighted, but that list is incomplete.  It only shows a few cities that have different regulations to let the reader know that state level fire codes aren’t the only regulations that schools have to follow.

The design does a good job of clarifying very complicated information, but that can only go so far.  The regulations are actually very complex, so this is still a very long design to thoroughly visualize the data.  Great job using visual design to help readers understand a very complex issue!

You can see additional designs that also cover the regulations for Hotels and Churches.

Monday
Jun182012

Client Infographic: U.S. Motorcycle Helmet Laws

Client Infographic U.S. Motorcycle Helmet Laws

This was a fun project to work on.  The Helmet Laws infographic is a visual reference for all motorcycle riders of the state-by-state helmet laws in the U.S., and also includes a few fact about the states with the highest fines and longest jail time as punishment for breaking those laws.  It’s a light-hearted design meant to make the complex mix of legal requirements easier to understand, because often riders don’t take the time to understand the laws as they cross state borders.

We are actively pursuing lawsuits for injured Michigan motorcyclists and wanted to create an infographic that would be a great resource for riders! The Helmet Laws infographic also displays which states have the highest fines and maximum jail time for violating their helmet law. You should share this infographic with other avid bikers who may be taking a ride across state lines

Only three states have no helmet laws at all (Iowa, Illinois and New Hampshire), and 20 states have strict, mandatory helmet laws.  The remaining 28 states fall somewhere in between (Total of 51 because the District of Columbia is included).

Client Infographic U.S. Motorcycle Helmet Laws Wallet Card

FREE Wallet Cards!  (No longer available)


As an added bonus, small wallet-size card (like a credit card) were printed by Buckfire Law that show just the map visualization and are available FREE to anyone that requests them!  These are meant for any motorcycle rider in the country to carry as a quick reference guide while riding.  You can find the instructions to request a free card on the Motorcycle page of the Buckfire site.  Scroll down past the infographic on their site and you’ll find the link to the online form.  Fill it out, and they will mail one to you for free, so share with anyone you know that rides.

Client Infographic U.S. Motorcycle Helmet Laws Wallet Card Photo

InfoNewt worked with Buckfire & Buckfire Law to develop the design and the wallet card program.  Thanks to the team at Buckfire for being great to work with!