About
Randy Krum
President of InfoNewt.
Data Visualization and Infographic Design

Infographic Design

Infographics Design | Presentations
Consulting | Data Visualizations

DFW DataViz Meetup

Join the DFW Data Visualization and Infographics Meetup Group if you're in the Dallas/Fort Worth area!

Search the Cool Infographics site

Custom Search

Subscriptions:


Feedburner

The Cool Infographics® Gallery:

How to add the
Cool Infographics button to your:

Cool Infographics iOS icon

- iPhone
- iPad
- iPod Touch


Read on Flipboard for iPad and iPhone

Featured in the Tech & Science category

Flipboard icon

Twitter Feed
From the Bookstore

Caffeine Poster

The Caffeine Poster infographic

Entries in voting (8)

Wednesday
Aug092017

Landslide for the "Did Not Vote" Candidate in the 2016 Election!

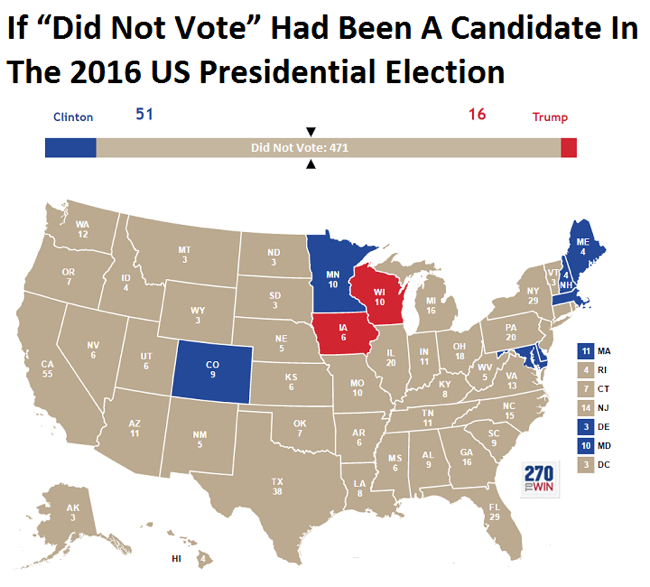
From BrilliantMaps, this is the Did Not Vote Election Map, showing the magnitude if all voting-eligible adults that did not actively vote in the 2016 Presidential election. A Presidential candidate needs 270 Electoral College votes to win. The "Did Not Vote" candidate would have have gathered 41% of the total votes from the voting eligible population, and 471 votes from the Electoral College! A Landslide!

The map above shows what the 2016 US Presidential Election results would have been if votes not cast for Hillary, Trump or one of the third party candidates had gone to fictional candidate “Did Not Vote.”

 As a percentage of eligible voters, Clinton received 28.43% (65,845,063) of all votes compared to Trump’s 27.20% (62,980,160) and Did Not Vote’s 44.37%(102,731,399).

Total voter turnout was estimated to be 55.3% of the voting age population and 59.0% of the voting eligible population.

Map created using 270 To Win, based on reddit user Taillesskangaru’s posts here and updated here.

Disclaimer: The map above was accurate as of January 17th, 2017. Totals below were true at the time of writing but may no longer currently be accurate as additional votes and recounts are conducted.

Thanks to Mike Wirth for sharing on Facebook!

Wednesday
Mar012017

A Visual Explanation of Gerrymandering

A Visual Explanation of Gerrymandering

The Washington Post recently published this simple but very effective visual explanation of Gerrymandering: How to steal an election: a visual guide

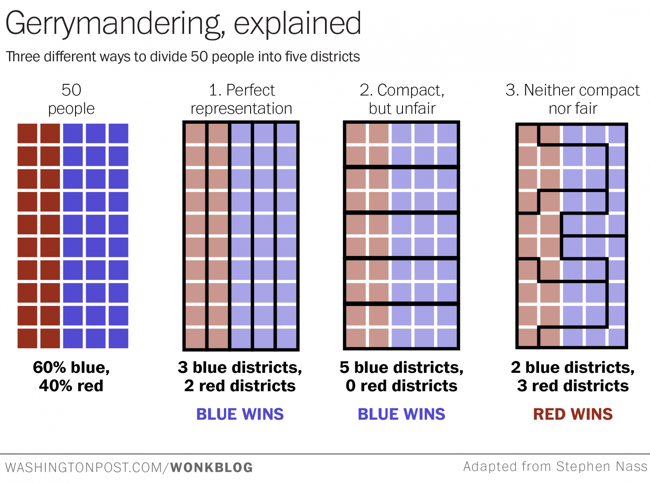
Gerrymandering -- drawing political boundaries to give your party a numeric advantage over an opposing party -- is a difficult process to explain. If you find the notion confusing, check out the chart above --  adapted from one posted to Reddit this weekend -- and wonder no more.

Suppose we have a very tiny state of fifty people. Thirty of them belong to the Blue Party, and 20 belong to the Red Party. And just our luck, they all live in a nice even grid with the Blues on one side of the state and the Reds on the other.

Now, let's say we need to divide this state into five districts. Each district will send one representative to the House to represent the people. Ideally, we want the representation to be proportional: if 60 percent of our residents are Blue and 40 percent are Red, those five seats should be divvied up the same way.

This is a great example of using data visualization to explain a complex process. The use of the matrix of squares to represent people simplifies the context and keeps the audience attention focused on the groupings.


Monday
Aug222016

Customizing 360 Photos - I Need Your Votes

Customizing 360 Photos for Digital Marketing

I NEED YOUR VOTES!

SxSW 2017 PanelPicker is open until September 2nd, and this is the community voting portion of the SxSW conference. This is a big part of getting accepted to speak at SxSW, and I need your votes to help support two proposals. My talks proposed for the 2017 conference relate to editing and publishing 360° photos with data visualizations and graphic elements for digital marketing. This is a new content format that can also take advantage of data visualizations and infographics!

Now that Facebook natively displays immersive 360° photos, you can use 360 photography to promote your product, service, and/or brand. However, just publishing raw images is already behind the curve. In this presentation I will teach you how to embrace this technology and harness its reach. You will learn how to inject your brand, call outs, data visualizations and graphic elements to make your 360 photos a full experience for your audience. This presentation will also cover how to optimize a 360 image file, adjust the metadata, demonstrate different editing tools, and help your brand take its marketing to the next level.

You'll need to sign in or create an account to vote. Here's the Login Page

Optimizing 360 Photos for Marketing Your Brand is my Solo talk proposal

Customizing 360 Photos for Digital Marketing is my Workshop proposal

You can help in three ways:

1. Click the links above and vote for my proposal.
2. Leave a positive comment about the talk or your experience with me.
3. Share this proposal on your social pages using the buttons from the SXSW website.

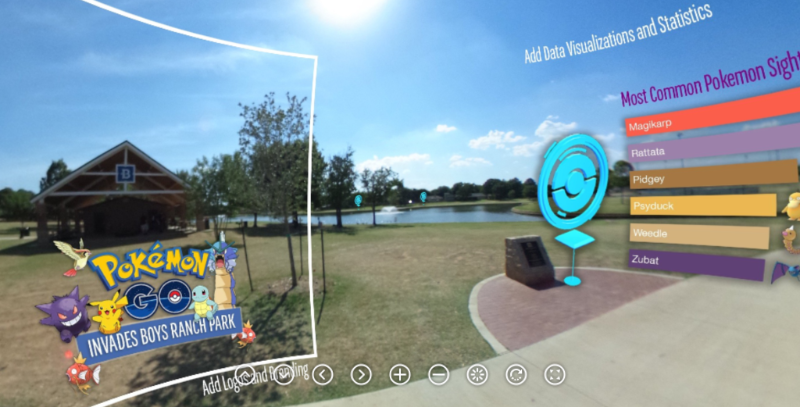
Below you can see a sample edited 360° image embedded here. This example image shows the potential for branding, callouts, data visualziations and other graphic elements that can be added before a company publishes a 360° photo. For example, the white square represents the original view when posted onto Facebook. 

Demonstration of adding graphics to Bedford Boys Ranch Pokemon GO Event 360 photo - Spherical Image - RICOH THETA

You can also see the original 360° photo here, before any of the graphic elements were added.

Friday
Jun242016

How Britain Voted in the E.U. Referendum

How Britain Voted in the E.U. Referendum map infographic

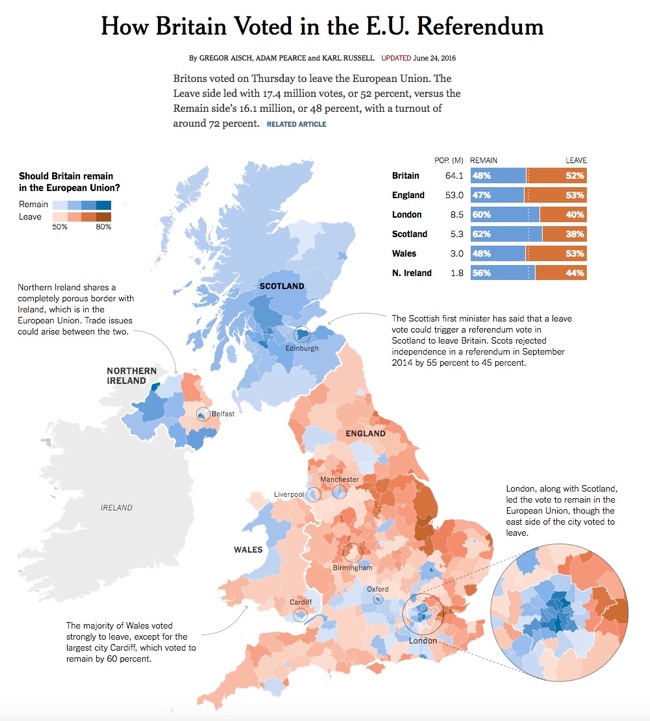
Britain voted on Thursday to part ways with the European Union. The vote was incredibly close, and this choropleth map visualization from the NY Times tells an intriguing story.

Britain has voted to leave the European Union, a historic decision sure to reshape the nation’s place in the world, rattle the Continent and rock political establishments throughout the West.

The margin of victory startled even proponents of a British exit. The “Leave” campaign won by 52 percent to 48 percent. More than 17.4 million people voted in the referendum on Thursday to sever ties with the European Union, and about 16.1 million to remain in the bloc.

Britons voted on Thursday to leave the European Union. The Leave side led with 17.4 million votes, or 52 percent, versus the Remain side’s 16.1 million, or 48 percent, with a turnout of around 72 percent.


Tuesday
May172016

Election Exodus - Moving to Canada?

Election Exodus - Moving to Canada infographic

Frustrated by the U.S. Presidential candidates? Ready to just pack up and move the Canada? The Election Exodus infographic from SpareFoot looks closer at what it would take for Americans to move North to Canada.

Trump or Clinton.

The prospective of either of these presidential frontrunners emerging victorious in November is too much for many Americans to bear.

A shocking number of U.S. citizens would consider a move to Canada—15 percent if Hillary Clinton is elected and 20 percent if Donald Trump is elected, according to recent polls.  (To be fair, we’re willing to bet there would be plenty of supposed defectors under President Sanders or Cruz as well.)

The question remains: How serious are these people? And how hard is it to move to Canada?

The answers to these questions and more lie below:

Designed by NowSourcing, this is a visually busy take on the side-by-side comparison style of infographic. A lot of text, and many of the statistics are not visualized, which makes it harder for readers to understand all of the information.

Thanks to Brian for sending in the link!

Friday
Aug212015

Visual Storytelling: The Big Trend for SXSW 2016

It’s only August, but voting is already underway for the March 2016 South By Southwest (SxSW) Interactive conference. Long thought of as the breeding ground for new ideas and creative technologies, we can gleam industry insights from the SXSW Interactive Festival. This year, I decided not to wait until the conference to delve into the veritable buffet of groundbreaking panels vying for festival space. This year’s PanelPicker interface received more than 4,000 proposals, which is an all-time record!

While a quick search of infographics yields only 11 results, a mere TWO actually have the word “Infographics” in the title. The industry discourse has shifted away from “how-to” models to “how to do it right.” Infographics have become a key format of the larger conversation: Visual Storytelling.

A quick search for “Visual Storytelling” yields over 200 talks in PanelPicker, along with hundreds more for “data visualization” and “visual content”.  Infographics are now used as one of many effective tools in the Marketer’s toolbox, and an accepted part of the larger conversation happening in the content marketing industry.

Visual storytelling is vital to content marketing success. The following types of visual content are at the forefront of the proposals for next year’s SXSW Interactive Festival.

1.    Animated GIFs

Source: Animagraffs by Jacob O'Neal

The social media world has been slow to adopt GIFs, with Facebook only just embracing the truncated clips this year. The average human attention span in 2015 is 8.25 seconds, so these bite-sized animations are the perfect for telling a complete story in a short amount of time. The motion in the image also captures attention on an already crowded news feed.

Check out these GIF-centric presentations, “Why GIFs are turning into the New Emojis on Mobile” and “Visual Storytelling - GIFs, Graphs, and Napoleon.


2.    Visual Presentations

Slideshare and other presentation-style platforms provide a visual and interactive way to share lots of information. With millions of visitors per month, Slideshare is an easy way to have your presentations seen by a large audience.

Perfect your visual presentations with “Sucking Less When Presenting Creative” and “The Power of Poise: Chi for Pitch and Presentation.”     


3.     Real-time storytelling

Real-time storytelling has increased in popularity with the rise of live feed social platforms like Periscope and Meerkat. The ease of execution and the sheer scope of the audience made these two platforms instantly successful. While Meerkat took the prize for most buzzed app at last year’s SXSW, Periscope has the weight of Twitter behind it and has become the more successful of the two.

Use these two tools to live broadcast your events, host a Q&A, or even share professional tips to a larger audience. Perfect your live-streaming with the “Live Streaming Killed Cable TV Star” and “Igniting Creativity with Periscope” PanelPicker proposals.

Twitter Periscope

Source: AdWeek


4.    Infographics

I couldn’t get through my list without mentioning infographics. Still one of the best ways to convey complex information in a shareable and visually appealing format, infographics should be worked into your content marketing strategy. While they are no longer the only way to tell a visual story, they remain a marketing industry staple.

Round out your visual storytelling prowess with great infographics. Learn how to rock your next infographic with my own proposal, “7 Deadly Sins of Infographics Design and How to Fix Them.

The Process of Designing an Infographic


Source: Visme 

Buzzword or not, visual storytelling is something we’ve all been doing since we first snapped a picture with a polaroid camera, we’re just getting better at it. Judging by PanelPicker entries alone, the 2016 SXSW Interactive Festival will be another great year for the content marketing industry.

Friday
Nov072014

The Most Detailed Maps from the Midterm Elections

The Most Detailed Maps from the Midterm Elections North Carolina infographic

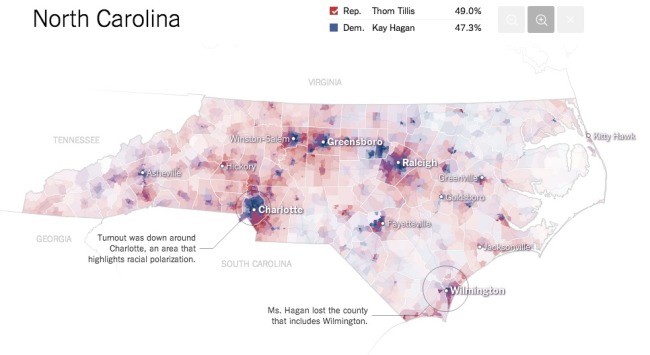
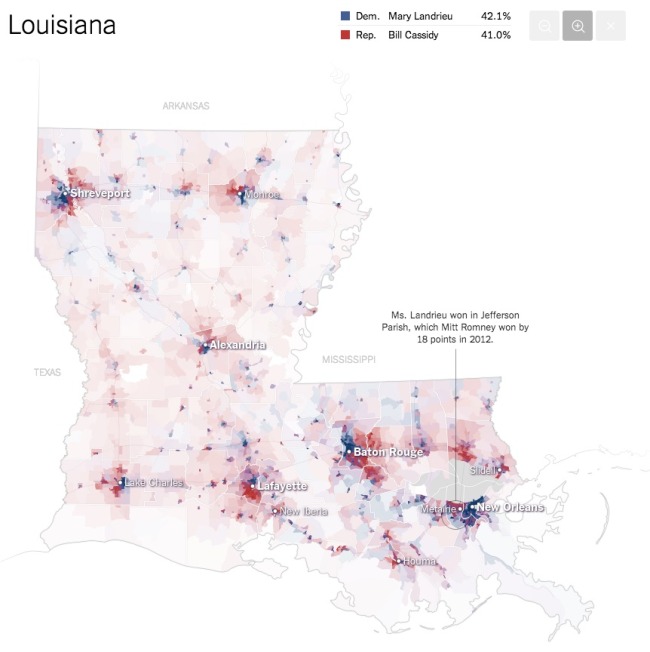
The team at the NYTimes has published these fantastic Most Detailed Maps from the Midterm Elections.

Why are we so confident these are the most detailed maps you’ll ever see from the 2014 Senate elections? Precincts are the smallest level of geography for publicly-reported election results. There were more than 175,000 precincts in the United States in 2012, fifty times the number of counties. The maps here show precinct-level results, where available, from some of the closest Senate races.

Maps exclude early votes in counties that do not report them by precinct. Some precinct boundaries are approximate.

I would call these Pop-Up Infographics, where the map is static, but additional details are shown in a pop-up frame when you hover over each voting precinct.

The Most Detailed Maps from the Midterm Elections Louisiana Infographic

Found on Flowing Data, and thanks to Mike Wirth for posting on Facebook!

Friday
Feb012013

America's New Minority

America's New Minority infographic

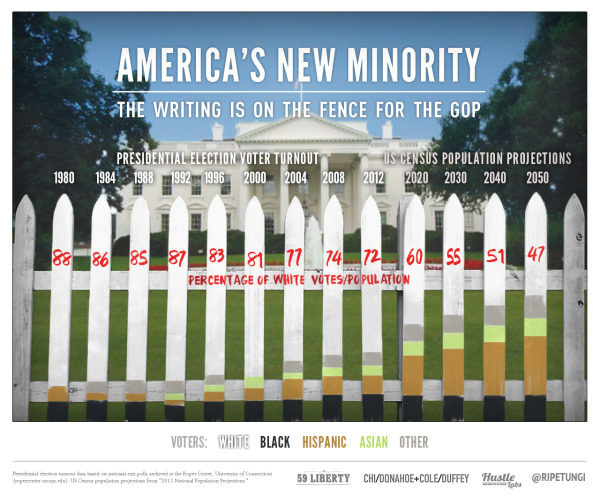
The demographics of America are changing, and America’s New Minority from 59 Liberty shows us how far we have come and predicts the next 40 years.  

With the country’s changing demographics, whites will drop under 50% of the population in the 2040s. Every Republican Presidential candidate since 1968 has won the white vote, but with the population shift can the GOP compete?

This graphic simply presents the data of a changing electorate. We went through numerous iterations attempting to find something appealing that presented the data accurately.

We worked with Projects by Chi/Donahoe on concepts, Ripetungi on design, and Hustle Labs for PR support.

For direct access to the data used, please view the spreadsheet here.

I really like how simple and strong the message is with this design.  The data will be surprising to many people, so it should be popular with social sharing.

I LOVE that they include a link to the raw data in a Google Docs spreadsheet for anyone to get their hands on the raw numbers from the data sources.  The link is in the additional text on the infographic landing page.  It would be more effective if the URL of the infographic landing page and the Google Docs spreadsheet were both included in the infographic so they would be readily available to readers who see the infographic posted on other sites.

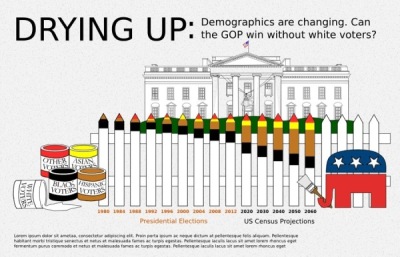
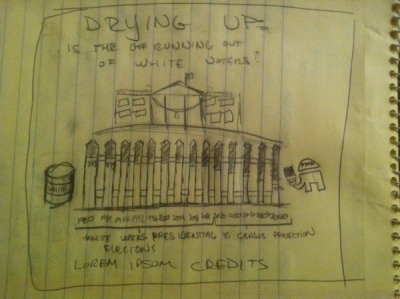
They also share some of the early drafts and other versions of the design they considered on the infographic landing page.  You can see a couple here, but there are more on the page at 59 liberty.

America's New Minority infographic

America's New Minority infographic