Customizing 360 Photos - I Need Your Votes
 Randy
Randy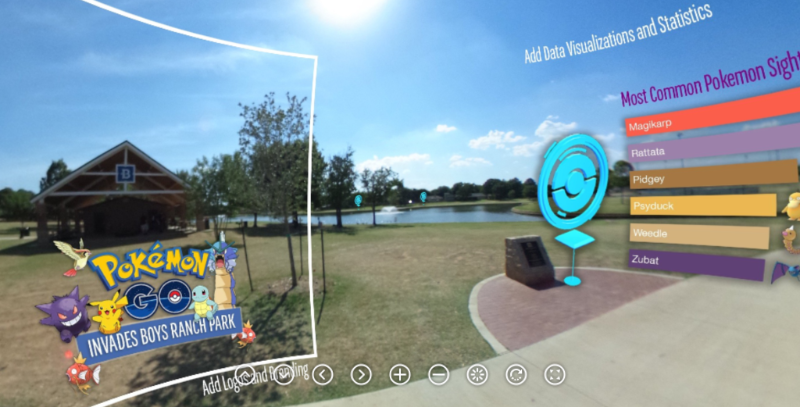
I NEED YOUR VOTES!
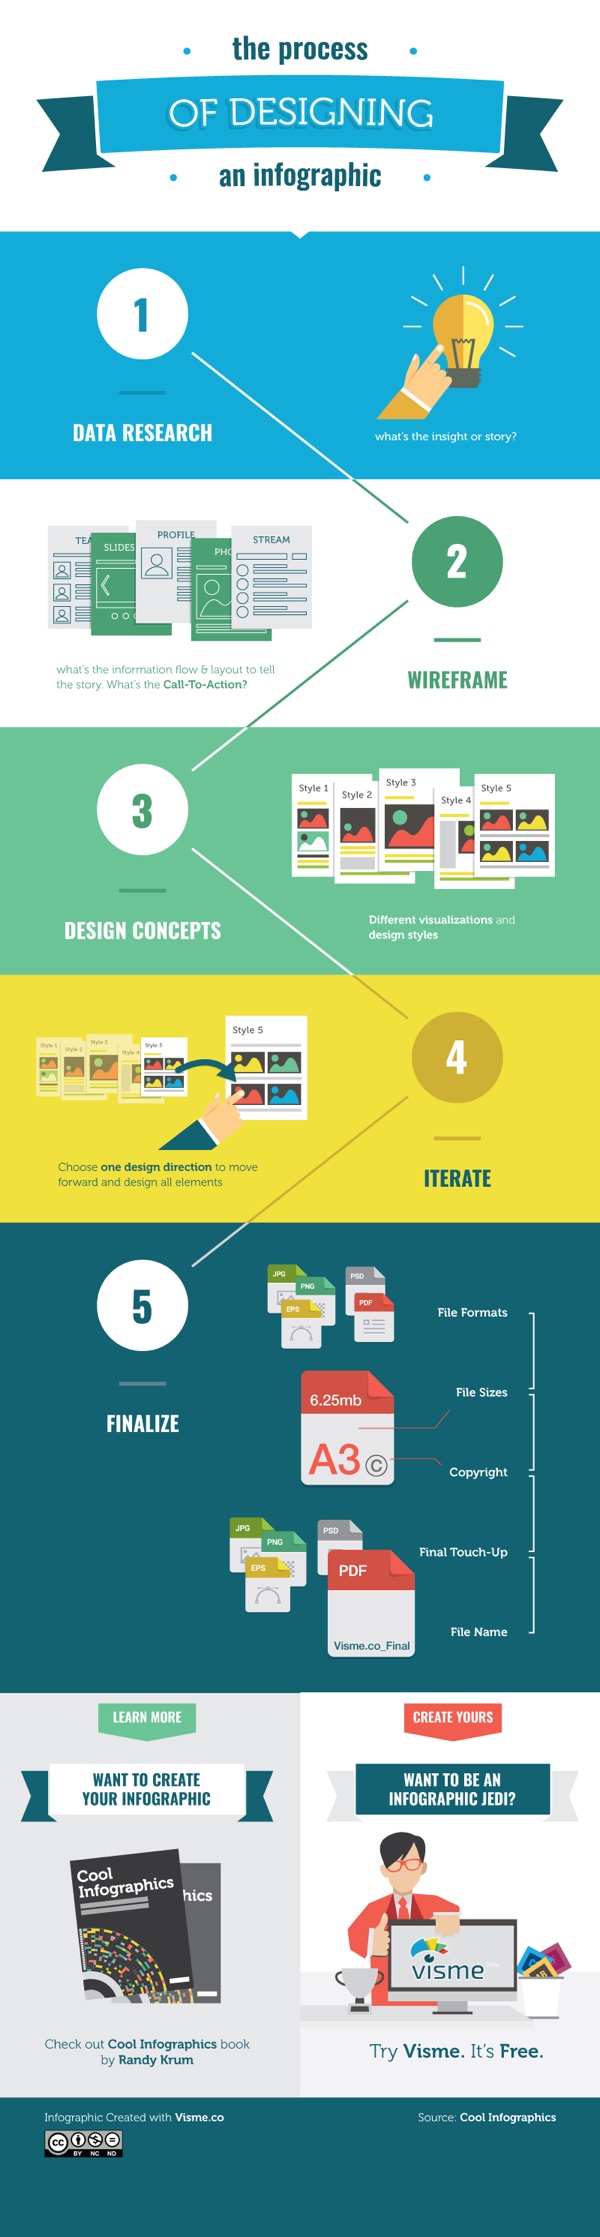
SxSW 2017 PanelPicker is open until September 2nd, and this is the community voting portion of the SxSW conference. This is a big part of getting accepted to speak at SxSW, and I need your votes to help support two proposals. My talks proposed for the 2017 conference relate to editing and publishing 360° photos with data visualizations and graphic elements for digital marketing. This is a new content format that can also take advantage of data visualizations and infographics!
Now that Facebook natively displays immersive 360° photos, you can use 360 photography to promote your product, service, and/or brand. However, just publishing raw images is already behind the curve. In this presentation I will teach you how to embrace this technology and harness its reach. You will learn how to inject your brand, call outs, data visualizations and graphic elements to make your 360 photos a full experience for your audience. This presentation will also cover how to optimize a 360 image file, adjust the metadata, demonstrate different editing tools, and help your brand take its marketing to the next level.
You'll need to sign in or create an account to vote. Here's the Login Page
Optimizing 360 Photos for Marketing Your Brand is my Solo talk proposal
Customizing 360 Photos for Digital Marketing is my Workshop proposal
You can help in three ways:
1. Click the links above and vote for my proposal.
2. Leave a positive comment about the talk or your experience with me.
3. Share this proposal on your social pages using the buttons from the SXSW website.
Below you can see a sample edited 360° image embedded here. This example image shows the potential for branding, callouts, data visualziations and other graphic elements that can be added before a company publishes a 360° photo. For example, the white square represents the original view when posted onto Facebook.
Demonstration of adding graphics to Bedford Boys Ranch Pokemon GO Event 360 photo - Spherical Image - RICOH THETA
You can also see the original 360° photo here, before any of the graphic elements were added.