A Visual Explanation of Gerrymandering
The Washington Post recently published this simple but very effective visual explanation of Gerrymandering: How to steal an election: a visual guide
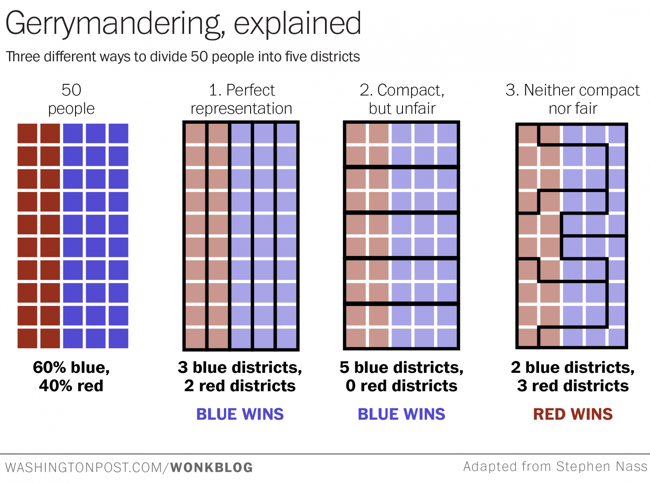
Gerrymandering -- drawing political boundaries to give your party a numeric advantage over an opposing party -- is a difficult process to explain. If you find the notion confusing, check out the chart above -- adapted from one posted to Reddit this weekend -- and wonder no more.
Suppose we have a very tiny state of fifty people. Thirty of them belong to the Blue Party, and 20 belong to the Red Party. And just our luck, they all live in a nice even grid with the Blues on one side of the state and the Reds on the other.
Now, let's say we need to divide this state into five districts. Each district will send one representative to the House to represent the people. Ideally, we want the representation to be proportional: if 60 percent of our residents are Blue and 40 percent are Red, those five seats should be divvied up the same way.
This is a great example of using data visualization to explain a complex process. The use of the matrix of squares to represent people simplifies the context and keeps the audience attention focused on the groupings.


 Randy
Randy

Reader Comments (2)
Each map shows the congressional districts for a single state and highlights one district. There are maps for 21 states. In other words, gerrymandering is a wide spread problem. While some of these highlighted district seats are held by democrats, most of these seats are held by republicans.
Gerrymandered voting districts at any level of government are a fundamental evil since gerrymandering allow politicians to chose their voters instead of allowing voters to chose their politicians.
You can help educate people about gerrymandering by reposting this message. Or just post one of the example map links. No one can look at these maps with thinking there is something basically wrong with drawing voting district lines like those that are highlighted on these maps.
For more information, please click “Map Tips” in the upper left corner of the map. Be sure to click the READ ME First button and find out about house bill 1102 which would require each state to have an independent commission that would be in charge of drawing congressional district boundaries. The states that already have an independent commission for this purpose are Alaska, Arizona, California, Idaho, Montana and Washington.
Alabama 2nd
https://mappingsupport.com/p/gmap4.php?congress=AL,2
Arizona 3rd
https://mappingsupport.com/p/gmap4.php?congress=AR,3
Colorado 1st
https://mappingsupport.com/p/gmap4.php?ll=39.731002,-104.889008&z=10&t=h&congress=CO,1
Connecticut 1st
https://mappingsupport.com/p/gmap4.php?congress=CT,1
Georgia 11th
https://mappingsupport.com/p/gmap4.php?ll=34.156757,-84.642578&z=9&t=h&congress=GA,11
Illinois 11th
https://mappingsupport.com/p/gmap4.php?ll=41.632428,-88.143096&z=10&t=h&congress=IL,11
Kentucky 1st
https://mappingsupport.com/p/gmap4.php?congress=KY,1
Louisiana 6th
https://mappingsupport.com/p/gmap4.php?ll=30.119052,-91.007781&z=8&t=h&congress=LA,6
Maryland 7th
https://mappingsupport.com/p/gmap4.php?ll=39.398579,-76.857392&z=9&t=h&congress=MD,7
Massachusetts 8th
https://mappingsupport.com/p/gmap4.php?ll=42.212800,-70.972840&z=9&t=h&congress=MA,8
Michigan 11th
https://mappingsupport.com/p/gmap4.php?ll=42.532384,-83.381897&z=9&t=h&congress=MI,11
Missouri 5th
https://mappingsupport.com/p/gmap4.php?congress=MO,5
New Jersey 12th
https://mappingsupport.com/p/gmap4.php?congress=NJ,12
Ohio 7th
https://mappingsupport.com/p/gmap4.php?ll=40.726493,-82.115723&z=8&t=h&congress=OH,7
Pennsylvania 17th
https://mappingsupport.com/p/gmap4.php?ll=40.908890,-75.463501&z=8&t=h&congress=PA,17
South Carolina 2nd
https://mappingsupport.com/p/gmap4.php?congress=SC,2
Tennessee 3rd
https://mappingsupport.com/p/gmap4.php?ll=35.864064,-84.546448&z=7&t=h&congress=TN,3
Texas 2nd
https://mappingsupport.com/p/gmap4.php?ll=29.916312,-95.350128&z=10&t=h&congress=TX,2
Virginia 10th
https://mappingsupport.com/p/gmap4.php?ll=38.997357,-77.737671&z=8&t=h&congress=VA,10
West Virginia 2nd
https://mappingsupport.com/p/gmap4.php?congress=WV,2
Wisconsin 3rd
https://mappingsupport.com/p/gmap4.php?ll=43.830114,-90.619140&z=7&t=h&congress=WI,3
In any democracy, this is 'perfect'. But there is no protection for the rights of the red voters.
In other words, once blue wins, the tyranny of the majority begins. We have been taught, in the US, that 'majority rules'. In reality, the Constitution protects the rights of the minorities, and the smallest minority is that of an individual.
So while voting laws cannot be crafted to properly protect all minorities, the Constitution was designed to protect the rights of the largest number of minorities as possible, by deflecting the concept of "majority rule".
Your infographic does a good job of EXPLAINING, but it only helps pursue the goal of the tyranny of the majority.
In a sense, your final infographic on why gerrymandering is somehow 'bad' actually crafts an argument for why it may be good. It actually DOES protect the minority.
You should do an infographic on Kenneth Arrow's theorem on why democracy doesn't, and can't, logically work. That's more meaningful.