About
Randy Krum
President of InfoNewt.
Data Visualization and Infographic Design

Infographic Design

Infographics Design | Presentations
Consulting | Data Visualizations

DFW DataViz Meetup

Join the DFW Data Visualization and Infographics Meetup Group if you're in the Dallas/Fort Worth area!

Search the Cool Infographics site

Custom Search

Subscriptions:


Feedburner

The Cool Infographics® Gallery:

How to add the
Cool Infographics button to your:

Cool Infographics iOS icon

- iPhone
- iPad
- iPod Touch


Read on Flipboard for iPad and iPhone

Featured in the Tech & Science category

Flipboard icon

Twitter Feed
From the Bookstore

Caffeine Poster

The Caffeine Poster infographic

Entries in games (28)

Thursday
Aug212008

Olympic Maps of Beijing


Let's not forget the Maps!  NYTimes.com has a number of interactive maps of the Beijing area showing the event locations, new architecture built for the Olympics, the demolition and expansion of the old city over the last 10 years, the new subway routes and some of the routes for the marathon and cycling events.

Wednesday
Aug202008

Olympics Schedule Tracker


The Olympics Tracker is an interactive schedule of the events.  It now only shows which events are scheduled each day and hour, but you can drag them to rearrange your favorites to the top.  Clicking on past events shows the results, and clicking on future events shows the upcoming event details.  Medal awarding events marked with a small medal icon.  You can even download a desktop version for Mac or Windows.

Tuesday
Aug192008

Olympic History of World Records


The History of World Records from NYTimes.com shows how the world record in a number of Summer Olympic events has progressively been beaten over the last 100 years.  In this chart, the Men's 100m Freestyle record was beaten three times this year improving the world record by 0.45 seconds.  Similar events are all charted together, so you can see other freestyle events on the same chart.

Monday
Aug182008

Olympics Medal Count Map


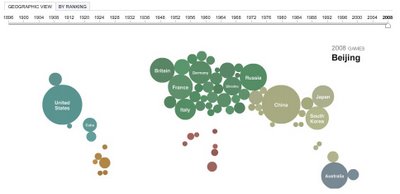
The Medal Count Map from the NYTimes.com show the total number of medals each country has won in every olympics since 1896.  Choose a year on the timeline to animate the graphic.  Rolling your mouse over a country will show the breakdown of Gold, Silver and Bronze medals and clicking will bring up a complete list of the events and medal winners.

Sunday
Aug172008

Evolution of Olympic Torches


The group at the NY Times online has been working overtime to create a bunch of infographics as part of their coverage of the 2008 Olympics.  I'm going to highlight them this week with many of the graphics they've created.  Their graphics are coming our rapid-fire just like the events in China.

First up is an Olympic Torch History graphic, highlight the torch designs since 1936 for both the Summar and Winter Olympic Games.   Roll over each torch to see deatils behind the design.

Thursday
Jun122008

WarCraft III DotA Poster


Created by Alwyn B., this hierarchical tree shows the complex Hero Item recipes for the WarCraft III MOD "Defense of the Ancients". As a fan and a player of the game, Alwyn painstakingly created his own infographic and then posted in on the Internet to share with other players. This makes a fantastic poster!

More than just the item combinations, the poster shows:

  • Shows the basic items and how to combine them to form better items.
  • Shows where to buy them, and for how much.
  • Mini Map that shows shop locations
  • Shop Item Layouts
When I looked today, this chart had been viewed over 100,000 times. Great job Alwyn, and thanks for sharing.

Wednesday
May142008

Pac-Man Explained


I thought this was great. This one image tells the whole story of the Pac-Man video game. No further explanation needed.

Found on digg.com

Wednesday
Apr162008

Quake Family Tree

From Wikipedia, the Quake Family Tree shows the history of the Quake computer game engine and all of the other games that were built from each version using a mind map.

Found on digg.com

Page 1 2 3