About
Randy Krum
President of InfoNewt.
Data Visualization and Infographic Design

Infographic Design

Infographics Design | Presentations
Consulting | Data Visualizations

DFW DataViz Meetup

Join the DFW Data Visualization and Infographics Meetup Group if you're in the Dallas/Fort Worth area!

Search the Cool Infographics site

Custom Search

Subscriptions:


Feedburner

The Cool Infographics® Gallery:

How to add the
Cool Infographics button to your:

Cool Infographics iOS icon

- iPhone
- iPad
- iPod Touch


Read on Flipboard for iPad and iPhone

Featured in the Tech & Science category

Flipboard icon

Twitter Feed
From the Bookstore

Caffeine Poster

The Caffeine Poster infographic

Entries in politics (59)

Monday
Sep172007

Human Trafficking

Found on VisualComplexity.com, this disturbing poster examines global human trafficking.

"It depicts each country's level of involvement (from Very High to Very Low) as either a country of destination or origin. The project concentrates on the smuggling of people from one country to another - mainly illegally. In many cases these people are forced to do work that is illegal, such as prostitution or child labor."
The poster was created by Taulant Bushi, and the original image is here.

Thursday
Aug302007

Katrina's Blame Game


Following the Katrina Diaspora graphic, here's another one related to Hurricane Katrina that maps the blame from different key figures and celebrities. I found this on mylifestream.net and originally from nytimes.com in October 2005.

Monday
Aug272007

Katrina's Diaspora

Originally from the nytimes.com in October 2005, I found this map graphic on mylifestream.net. This shows the geographic distribution of applications to FEMA for aid from Katrina victims. Presumably, that means the application locations imply where displaced Louisiana residents moved to.

Wednesday
Aug082007

2008 Presidential Campaign Finances


This interactive infographic from the New York Times website is really impressive. Using weekly data reported by the Federal Election Commission, it plots the contributions on a map of the U.S. and sizes the bubbles based on contributions from that city. It has data from every week since January 1st, so it will also "play" and animated version showing the contribution as time progresses (similar to the Trendalyzer that Google purchased from GapMinder).

You can also search for specific contributors to see which candidate campaigns they have contributed to, and how much they gave.

Sunday
Aug052007

The Coming Water Wars


Another graphic from Jonathan Harris from his time at Princeton with the International Networks Archive. It's a couple years old, but absolutely still relevant. I believe this is from around 2003.

Added: Recently popular on Digg.com

Tuesday
Jul242007

Hans Rosling @ TED 2007

Here's part two, when Hans Rosling followed-up his 2006 presentation with updated software in 2007. It looks like he's been able to get more data from the UN also.

He gets really excited while describes what's happening as the software animates the data about world health.

Tuesday
Jul242007

Hans Rosling @ TED 2006

Hans Rosling is a professor from Sweden who is an expert in world health, but has pioneered some amazing ways to look at massive amounts of data. I mean truly AMAZING. I can think of at least a dozen uses for this software to help visualize changes over time. Don't let the topic scare you, this is incredible to watch.

The Trendalyzer software (recently acquired by Google) turns complex global trends into lively animations, making decades of data pop.
This video is one of the TED Talks videos from the 2006 TED Conference.

http://www.ted.com/talks/view/id/92

Sunday
Jul222007

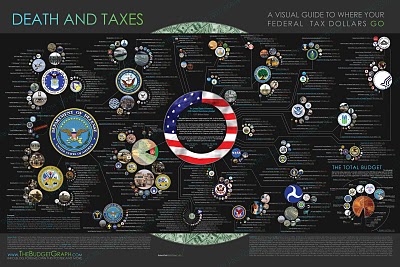
Death and Taxes 2008

NEW Death and Taxes infographic for 2008!


It is the 2008 Federal discretionary budget of the United States. is a representational poster of the federal discretionary budget; the amount of money that is spent at the discretion of your elected representatives in Congress. Basically, your federal income taxes. The data is from the President's budget request for 2008. It will be debated, amended, and approved by Congress by October 1st to begin the fiscal year.
So this is what the President is asking for, not the final budget. Compare this to the final 2007 discretionary budget from my earlier post.

An interactive Flash version is online at www.thebudgetgraph.com/poster.

Saturday
Jul212007

Top Presidential Contributions 1Q


It's early for the 2008 election, but major campaign funding has already started. It will be interesting to see if more money early in the race makes a difference in the outcome.

From washingtonpost.com

Page 1 ... 2 3 4 5 6