About
Randy Krum
President of InfoNewt.
Data Visualization and Infographic Design

Infographic Design

Infographics Design | Presentations
Consulting | Data Visualizations

DFW DataViz Meetup

Join the DFW Data Visualization and Infographics Meetup Group if you're in the Dallas/Fort Worth area!

Search the Cool Infographics site

Custom Search

Subscriptions:


Feedburner

The Cool Infographics® Gallery:

How to add the
Cool Infographics button to your:

Cool Infographics iOS icon

- iPhone
- iPad
- iPod Touch


Read on Flipboard for iPad and iPhone

Featured in the Tech & Science category

Flipboard icon

Twitter Feed
From the Bookstore

Caffeine Poster

The Caffeine Poster infographic

Entries in relative (157)

Wednesday
Jun152011

Caffè Italiano: 50 Types of Italian Coffee


Caffè Italiano is another mouth-watering infographic from CharmingItaly.com.  I love how they took what could have been a standard drink ingredients visualization one step further and designed it as a menu board for an Italian coffee bar.

For Italians, coffee break is a sort of ritual in which the conviviality is a key point. Around a good coffee you can have a chat, take a few minutes for yourself and relax. It’s not just about inserting something into the stomach.

For Italians, drinking a good coffee is a pleasure: it is something to be sipped and not to be swallowed down; it is something to relish in the fullness of its flavour.

This is why a bad coffee gets Italians in a bad mood, while a good coffee can make their day!

When you enter an Italian Bar, around the clock, pay attention on what’s around you: we bet you won’t find 10 people ordering the same type of coffee!

The types of coffee in the Infographic are written in Italian, so you will be able to order them in the right way at the Bar!

The only problem is that there isn’t any guide or legend for the reader to understand the meaning behind the different colored portions of each drink.  They look carefully designed to be accurate to the how the drinks are mixed, but that effort is lost without an explanation.

Thanks to Paolo for sending in the link!

Tuesday
Mar222011

The Radiation Dose Chart

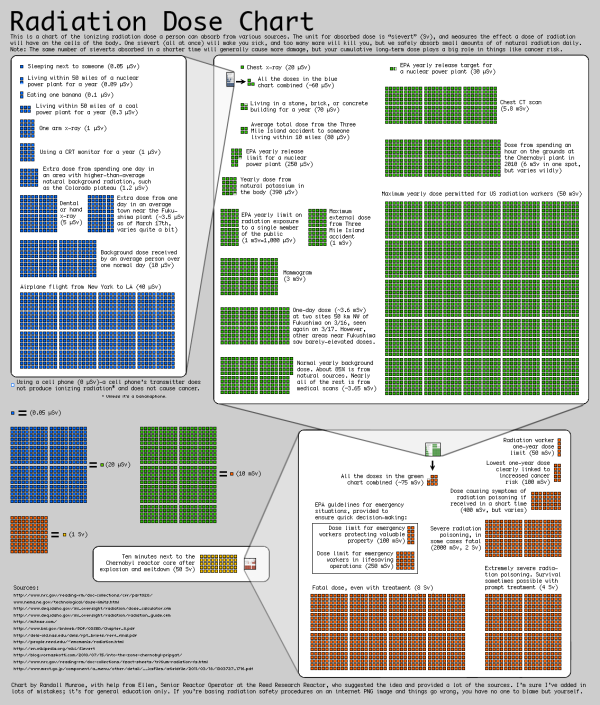
The Radiation Dose Chart from XKCD.com is very cool.  Not part of the usual stream of comics, this is a more scientific chart from Randall Monroe helping to visualize the facts about radiation exposure.

There’s a lot of discussion of radiation from the Fukushima plants, along with comparisons to Three Mile Island and Chernobyl. Radiation levels are often described as “<X> times the normal level” or “<Y>% over the legal limit,” which can be pretty confusing.

Ellen, a friend of mine who’s a student at Reed and Senior Reactor Operator at the Reed Research Reactor, has been spending the last few days answering questions about radiation dosage virtually nonstop (I’ve actually seen her interrupt them with “brb, reactor”). She suggested a chart might help put different amounts of radiation into perspective, and so with her help, I put one together.

I’m not an expert in radiation and I’m sure I’ve got a lot of mistakes in here, but there’s so much wild misinformation out there that I figured a broad comparison of different types of dosages might be good anyway. I don’t include too much about the Fukushima reactor because the situation seems to be changing by the hour, but I hope the chart provides some helpful context.

Found on Bad Astronomy, Daring Fireball, FlowingData and VizWorld.

Friday
Feb182011

The 2011 Massachusetts Budget infographic poster

Jess Bachman, from ByJess.net,  has designed this new government budget poster of the 2011 Massachusetts Budget for The Pioneer Institute.

The most largest and most detailed visualization of a state budget ever, this 864 sq in poster (not for sale) compares hundreds of programs and expenditures from the billions down to the thousands of dollars.  If you really want to see how a state (like Massachusetts) spends it’s tax payers money, this is it.

The above graphic is a massive visual guide to the Massachsettes state budget. It presents hundreds of government departments, agencies, and programs in a visual format, proportionate in size to their funding level. The largest item is $15 billion, the smallest is $65 thousand.

Similar to his Death & Taxes poster of the Federal budget, the Massachusetts Budget poster is highly detailed, showing how spending for every department is broken down.


Although it’s not clear if The Pioneer Institute will make posters available for purchase, you can see the full detail online in this high-definition zoomable image.  (Check it out full-screen too!)


Monday
Jan172011

The Sequel Map - Is Part II Ever Better than the Original?


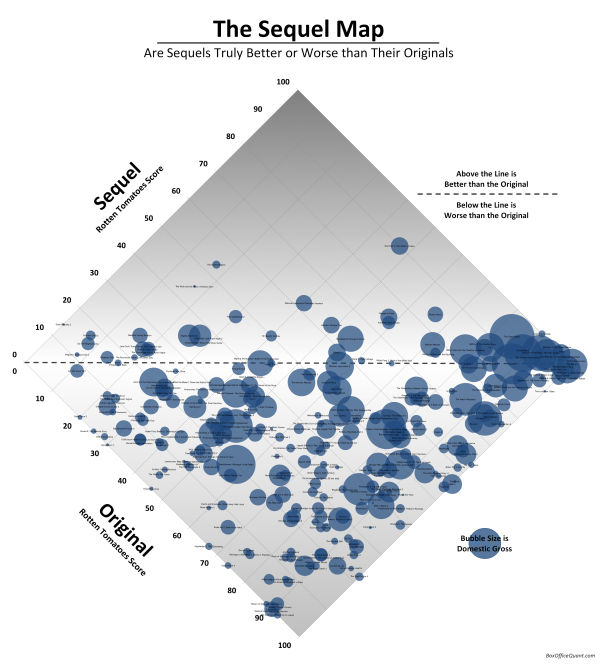
The Sequel Map, from BoxOfficeQuant.com is a cool chart of movie sequels showing how they compared to the original.  The location is based on the RottenTomatoes.com scores of the original and the sequel being plotted.  If the scores are the same, the movie would be exactly on the line, and any sequel with a score higher than the original is above the line.  The sizes of the bubbles represent the total box office receipts.

As evidence, all sequels with Rotten Tomatoes scores have been categorized below, with the originals’ scores on the X-axis, and the sequels’ scores on the Y. Films at the center line are sequels with the exact rating as the original; films above are sequels that have surpassed the original; films below, ones that fared worse.

Notes: Categorization of sequels is sometimes more art than science, so I’ve had to follow a few rules: I’ve only included the second film in any series, never third or following films. I haven’t included remakes or “reboots,” and I’m only presenting films which opened (at some time) in the US and have Rotten Tomatoes ratings.

And finally, it’s worth noting that the only two film/sequel combos to both score 100%, are the first two Toy Storys and the French films Jean de Florette / Manon des Sources.

Rotten Tomatoes ratings from RottenTomatoes.com. US Gross from www.the-numbers.com

I especially like turning the chart 45°, which puts the best score possible for a sequel to improve on the original at the top center of the chart.  If both the original and the sequel scored high, the bubbles are located towards the right instead of the top.  I’ve done this with a number of 2x2 quadrant charts for clients.

So, according to the chart, Star Trek II: The Wrath of Khan was the best sequel improvement over the original, and I would have to agree.

I’d love to see a version that plots the box office receipts on the X and Y axes so that it would show the instances where the sequel made more money than the original.  You could see more of the financial incentive behind making sequels, even if they’re generally rated lower than the original.

Found on VizWorld.com

Thursday
Oct142010

Map of Online Communities 2


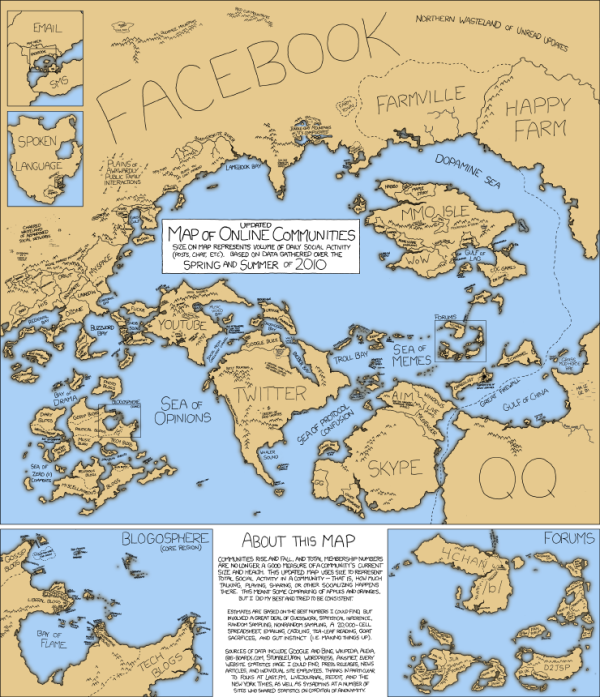
This is one of my favorites.  xkcd has updated their Map of Online Communities for 2010!  This is an update from the original 2007 Map of Online Communities, and has changed quite a bit.

Communities rise and fall, and total membership numbers are no longer a good measure of a community’s current size and health.  This updated map uses sizes to represent total social activity in a community - that is, how much talking, playing, sharing or other socializing happens there.  This meant some comparing of apples and oranges, but I did my best and tried to be consistent.

You can also view the LARGE version, or pre-order the poster.

Thursday
Sep302010

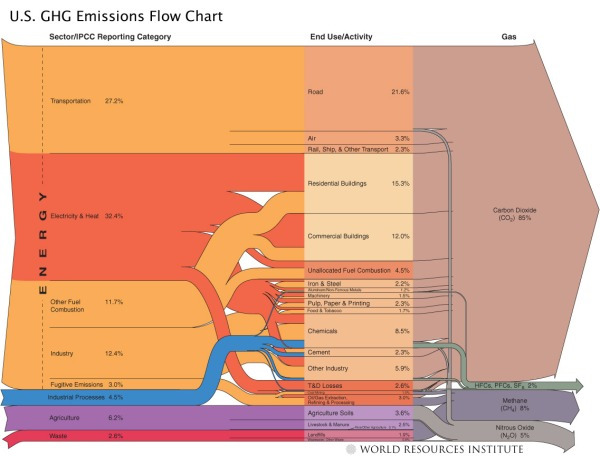
World GHG (Green House Gasses) Emissions Flow Chart

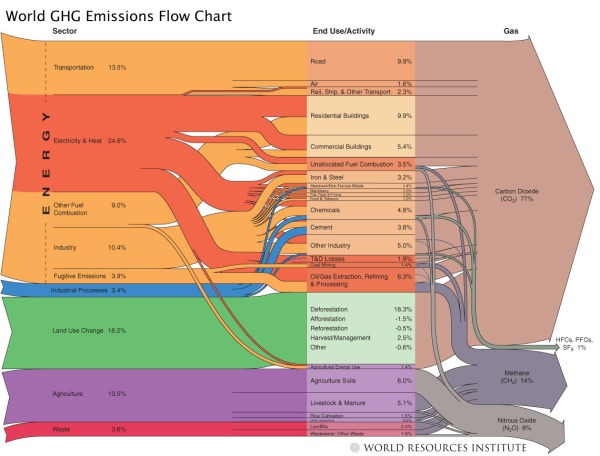
From the World Resources Institute, the World GHG Emissions Flow Chart needs a new name, but shows the composition of GHG (Green House Gasses) emissions and where they come from.

Sources & Notes: All data is for 2000. All calculations are based on CO2 equivalents, using 100-year global warming potentials from the IPCC (1996), based on a total global estimate of 41,755 MtCO2 equivalent. Land use change includes both emissions and absorptions; see Chapter 16. See Appendix 2 for detailed description of sector and end use/activity definitions, as well as data sources. Dotted lines represent flows of less than 0.1% percent of total GHG emissions.

They also have this one for just U.S. GHG emissions:

Found on Data Mining: Text Mining, Visualization and Social Media

Tuesday
Sep142010

Your Lying Pants! (an infographic)

The Pants Size Chart is a great, simple infographic from The Style Blog on Esquire.com.

The devastating realization came in H&M. Specifically, in a pair of size 36 dress pants. I’d never bought pants at H&M before, and suddenly asked myself: how could a 36-inch waist suddenly be so damn tight?

I’ve never been slim — I played offensive line in high school — but I’m no cow either. (I’m happily a “Russell Crowe” body type.) So I immediately went across the street, bought a tailor’s measuring tape, and trudged from shop to shop, trying on various brands’ casual dress pants. It took just two hours to tear my self-esteem to smithereens and raise some serious questions about what I later learned is called “vanity sizing.”

Your pants have been deceiving you for years. And the lies are compounding:

Found on Chart Porn and Daring Fireball

Tuesday
Sep072010

Labor Day by the Numbers

Appropriate for this week in the U.S., Labor Day by the Numbers takes an infographic look at labor statistics, top jobs in the U.S. and facts about the Labor Day holiday.  From fixr.com.

Thanks to Andreas and Thussa for the link!

Wednesday
Apr282010

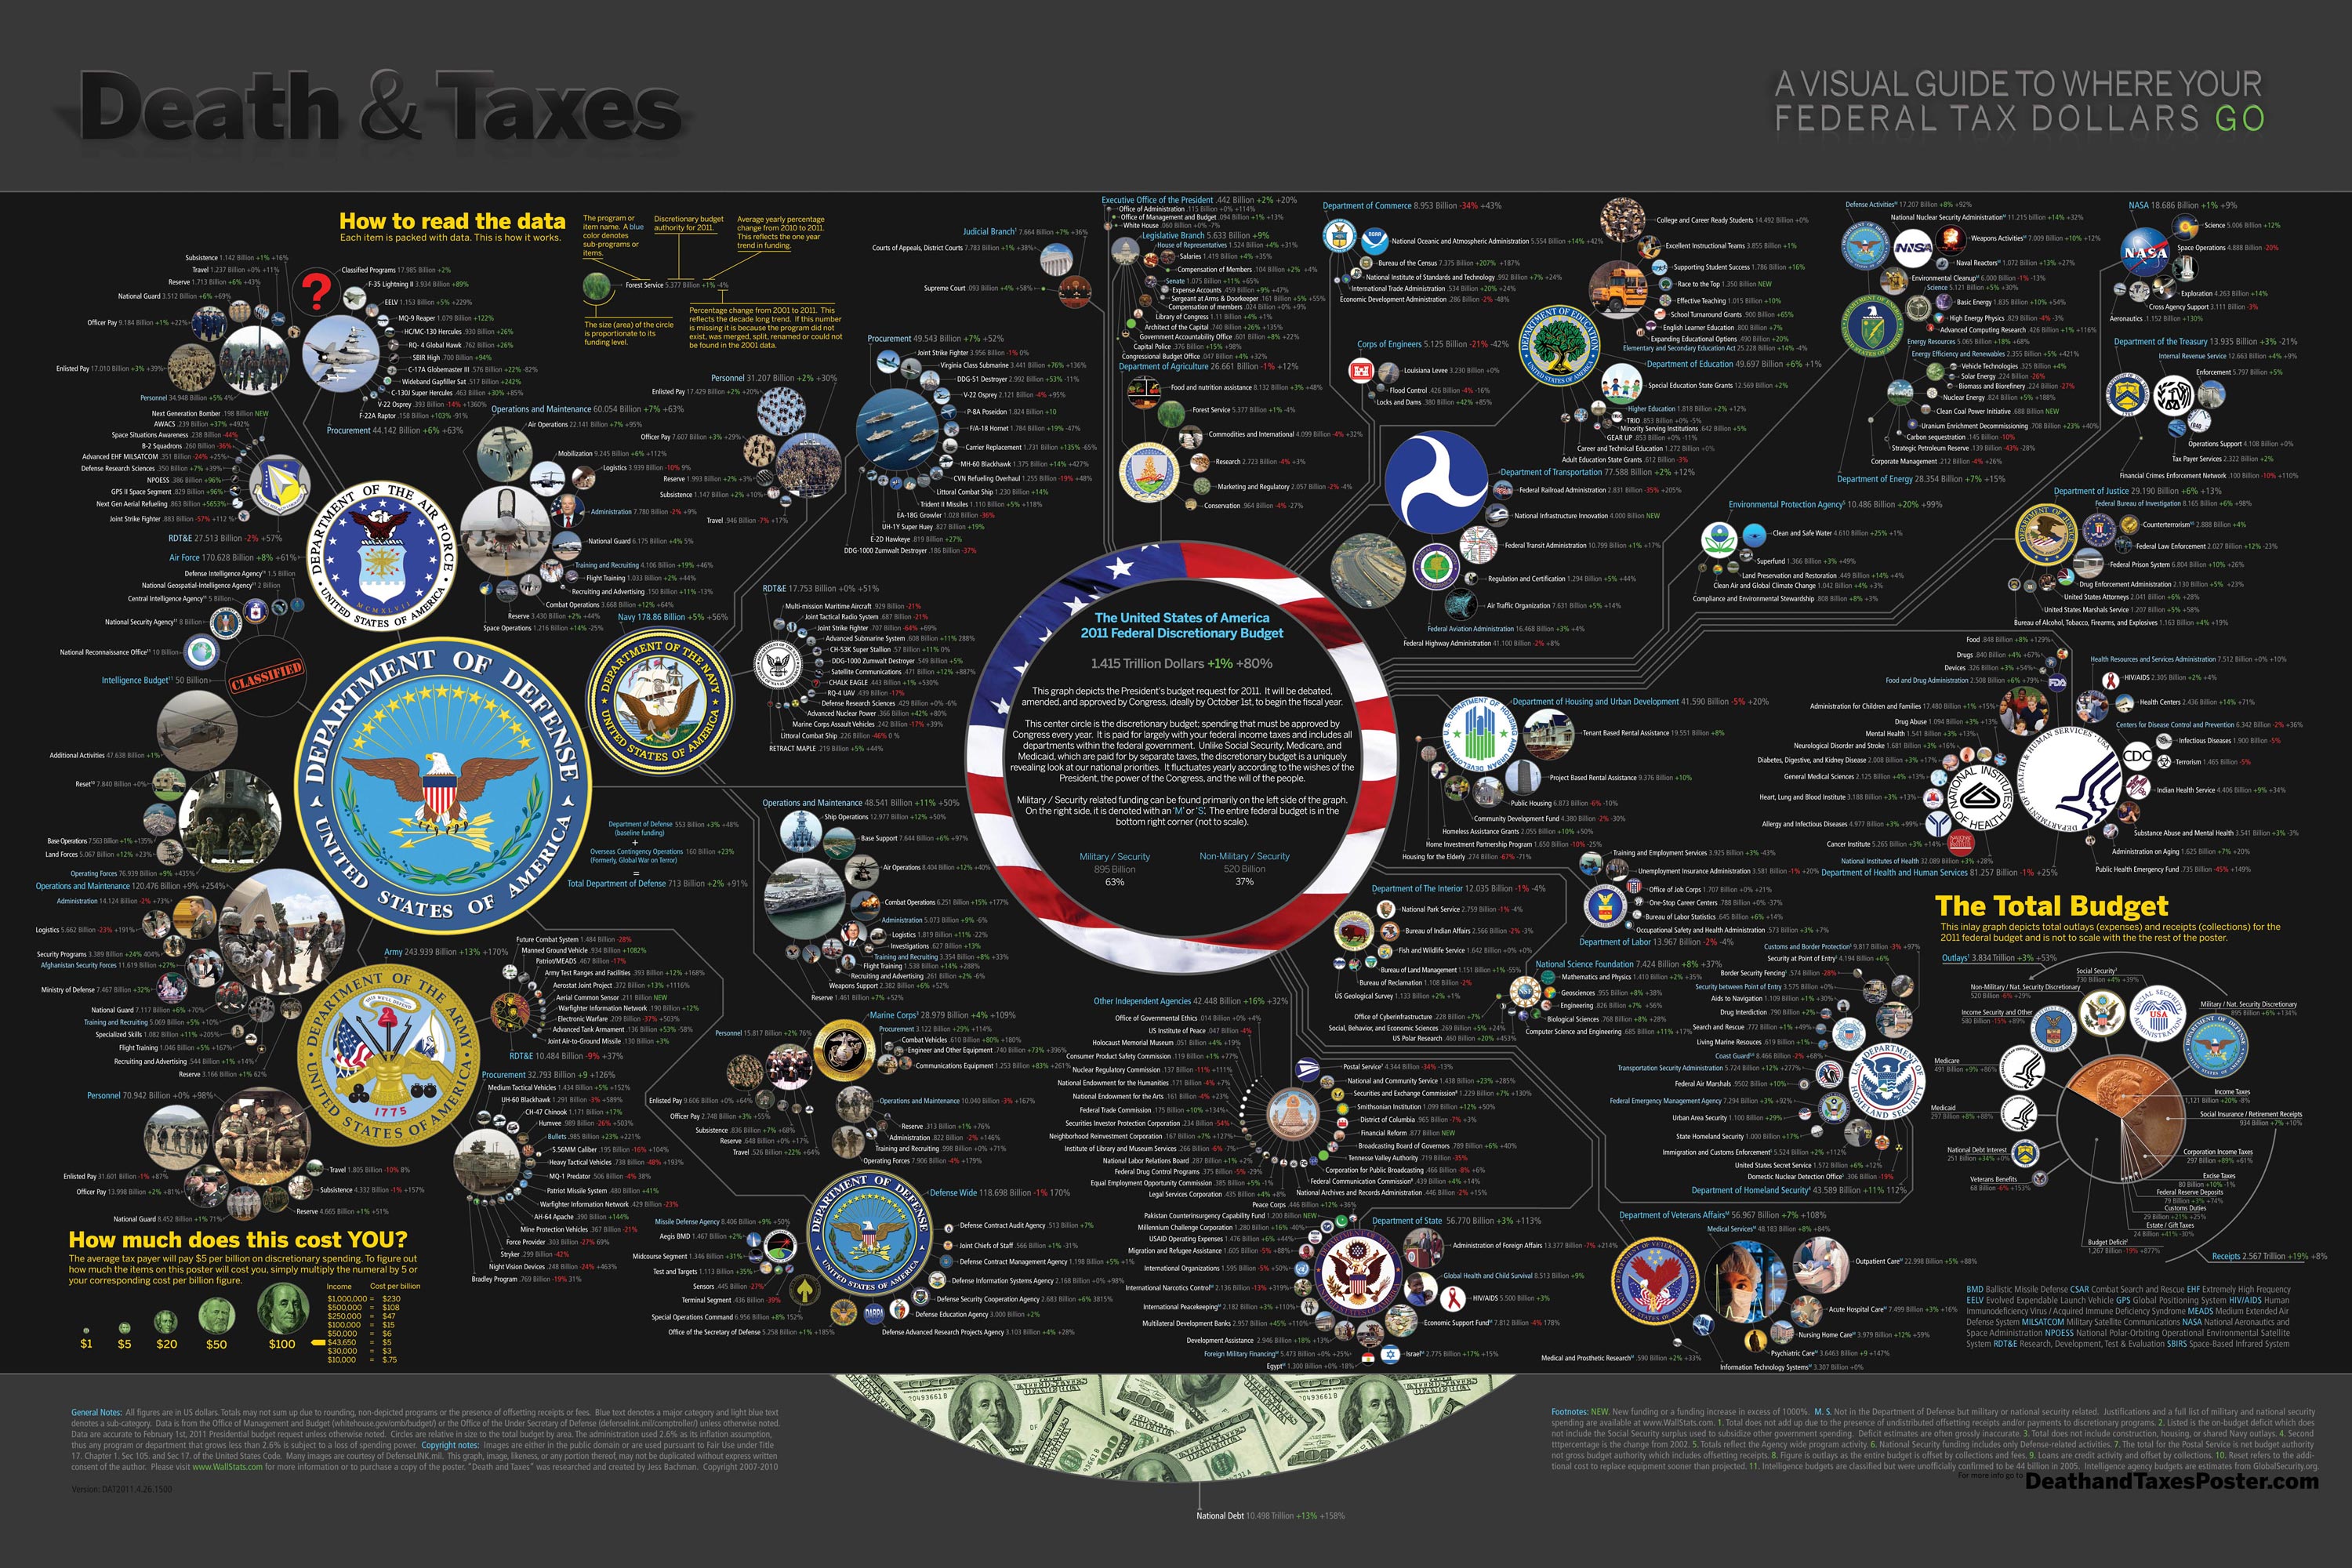
Jess Bachman Interview (Death & Taxes 2011 Poster Giveaway!!)  #deathandtaxes

Last week, Jess Bachman (@mibi) from WallStats.com released the new 2011 Death & Taxes poster.  I caught up with Jess (by email) to ask some questions about his huge infographic undertaking.  The high-resolution image of the poster is available now online, and the printed version will start shipping on May 7th.  You can pre-order for $24, and the shipping cost is only $0.75 TODAY (April 28th)

WIN a copy of the poster!  Jess has been kind enough to offer a free poster to a reader of Cool Infographics.  To be eligible, you must tweet (or retweet) a link to this post on Twitter before May 7th, and include the #deathandtaxes hashtag.  I included the hashtag in the post title, so any retweets will be automatically eligible.  NOTE: you must also be following me on Twitter (@rtkrum) so that I can send you a DM if you have won!

Death and Taxes” is a large representational graph and poster of the federal budget. It contains over 500 programs and departments and almost every program that receives over 200 million dollars annually. The data is straight from the president’s 2011 budget request and will be debated, amended, and approved by Congress to begin the fiscal year. All of the item circles are proportional in size to their funding levels for visual comparison and the percentage change from both 2010 and 2001 is included so you can spot trends.

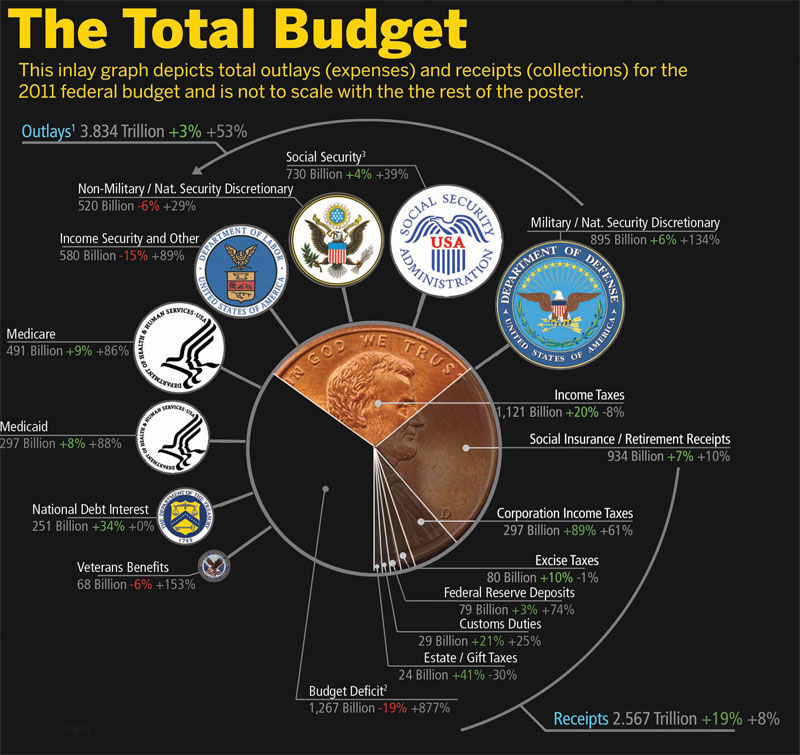
The detail in this poster is stunning, and in this small shot you can see how the total budget request breaks out. Only the “Military/Nat. Security Discretionary” and “Non-Military/Nat. Security Discretionary” portions of the budget request details are displayed in the poster.
 

Jess was also nice enough to answer a few interview questions I sent him:

Cool Infographics: What software applications do you use for the Death & Taxes posters?

Jess Bachman: The only applications I use are Photoshop and Excel.  Excel is where I in put all the data and it crunches the numbers, adjusts for inflation and calculates diameters.  Photoshop is where I put it all together and the PSD file occasionally exceeds 1 gig so it can be a beast to work with.  Saving takes about 5 minutes.

Cool Infographics: What’s your design process?

Jess Bachman: Normally I start from scratch and layout the images and make them fit; however, this year the budget didn’t change all that much, likely being from the same President, so I was able to keep the 2010 format and change the size of circles.  Of course some things had to be added and removed.  So this year I saved myself about 3 weeks of work just getting right into it, but the design process is grueling.  it’s small tasks, repeated 500 times.

Cool Infographics: What’s the most interesting thing you learned from the data?

Jess Bachman: I can definitely see the differences in Presidents from Bush to Obama.  Lots of reductions on the military side this year and the whole security climate as a whole isn’t as fiscally robust as it was a few years ago.  Much more progressive funding with Obama too.  Every year Bush would cut climate change research, now its back, along with other green tech.  For some reason, public proadcasting gets the hack saw every year no matter who’s in office.

Cool Infographics: Where are some of your favorite places that have the Death & Taxes poster on display?

Jess Bachman: Well it’s always good to see it on display in schools and classrooms.  But I really enjoy hearing from military members who have in their offices or even in station.  I have sent several to Afghanistan.  Critics often say the poster is anti-military, but the military is quite receptive to it, even the former Dept. of Defense Comptroller, Tina Jonas, loved the poster.  Some people from the Dept of Energy’s Oak Ridge Lab displayed the poster on their 30’ Everest computer screen… that was cool too.

Cool Infographics: What’s the hardest part when developing the poster?

Jess Bachman: The hardest part is just getting through all the rote data processing and mindless photoshopping.  The research side is quite fun, and going through the military budgets is a trip with all their classified and hi-tech programs. However, copying and pasting 5,000 times really takes a toll on my creativity and motivation.

Cool Infographics: You said you do a lot of copy & paste work, in what format do you get the data?

Jess Bachman: Some of the government data is in Excel already, but there is no context so I am dubious about working solely with their data sets.  Mostly I pull the numbers from the actual printed budget, which is in PDF form.  So I end up copying and pasting the program name and its funding level for 3 years into Excel, then I copy and paste the program name, funding level, and percentages back into photoshop as a text layer.  Rinse and repeat 500 times.  Many people ask if there was an automated way to create the poster each year and I wish there was, but the confines of the paper make size and fit a manual process.

Cool Infographics: Where do you have them printed, what are the printing specs and why?

Jess Bachman: I get my posters printed from a company called PrintPelican in Florida.  There really are no cheaper prices out there but I opt for a thicker cut of paper than usual.  I get 100# gloss cover which is a few shades from a business card in thickness.  To be honest, they have screwed up my order a few times over the years but we have always managed to work it out.  I usually print runs of 1000-2500 and always 24” x 36”.

Cool Infographics: How do you handle all of the printing and shipping of the posters?  Do you tube them yourself?

Jess Bachman: I used to do it all myself.  I had a 400lb brick of posters next to my bed, and 12 giant boxes of tubes all over the house, and I would roll pack and ship them all.  Now I use two shippers who do fulfillment of the orders for me.  For a while I would send them the orders and addresses weekly but I have offloaded that duty as well.  I think the self shipping method is a good lesson in customer service and its good to know your product inside and out, but after while my time became more valuable than stuffing tubes could afford.

Cool Infographics: You’ve used a few different online zoomable image services in the last few years, what have you learned?

Jess Bachman: There are lots of zooming options out there and new ones seem to pop up all the time.   I used Zoomify until it felt too clunky and slow, then Zoomorama which I really loved for its performance and options.  This year I experimented with an self hosted open source app called Open Zoom and it certainly was a slick and great user experience, unfortunately the demands it placed on my server from huge inflows of traffic proved too much, taking down the whole site.  So I had to switch to my backup, which was Closr.it, and let them deal with server demands.  Closr.it has been very attentive to my needs and I have found that most developers will work with me to tailor a custom solution if I ask.  The zooming apps keep getting better so I expect to keep changing apps as long as the space keeps innovating.

Cool Infographics: You mentioned the 30’ display, have you printed it out in larger sizes?

Jess Bachman: No, I have not printed it out any larger.  The file being Photoshop, and the images being mostly rastered do not allow quality printing beyond the poster size.  The file is 300 dpi so I could get away with a slightly larger size, but oversize printing is expensive and who wants a poster that big anyways. 

Cool Infographics: Where do the images come from?

Jess Bachman: Most of the military images come from defenseLINK, which is a great repository for hi-res military photos.  Other images come from stock photography sites for the most part.  It does help that most government logos are round.  I suppose it’s just an old school way of doing things, government seals and all.  The design aesthetic amongst government logos is really all over the map though, and its quite interesting.  Some look like that are from the 1700’s, and some from the 2700’s.

 There was one correction to the online version that Jess has posted:

So I totally had the wrong data for NASA on the visual. Here is the corrected image, which reflects what you have been reading in the news. Science up, space down. I fixed it before it was printed, don’t worry.
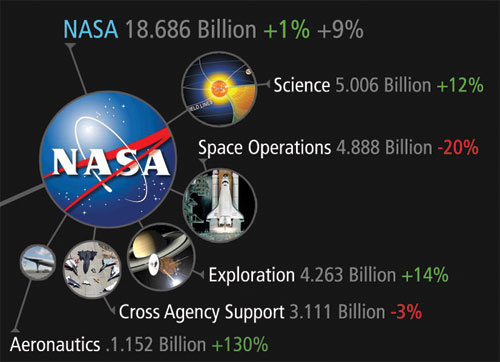
You can view the image, buy the poster and more at the new site DeathandTaxesPoster.com.

SPECIAL: If you pre-order the poster TODAY (April 28th) shipping is only $0.75!

Monday
Apr122010

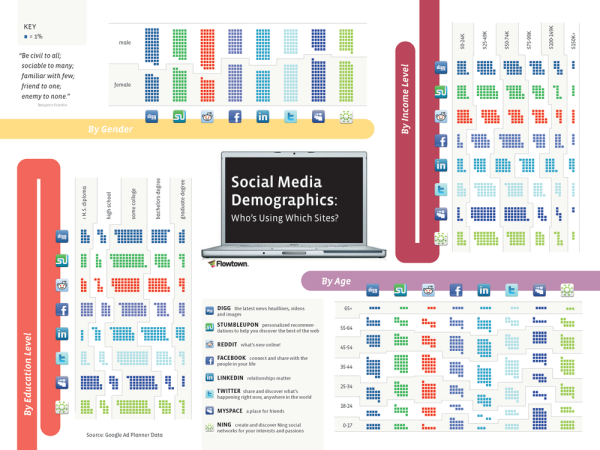
Social Media Demographics - infographic

I like the “small squares” style used in Social Media Demographics for displaying demographic data.  The “by age” section is hard to read because it lines up so nicely with the site legend.  It’s also a little confusing to have the sites change axes for the different sections.


Numerous social media sites have witnessed explosive growth of their user bases in the last several years, but it’s a known fact that the type of user a site attracts varies greatly. Have you ever wondered which sites attract the most educated of social media users, or those that pull in the highest income? Below we map the demographics of the world’s most popular social media sites.


Is MySpace really that popular with the 0-17 crowd?  What year is the data from?

Found on Flowtown.com

Page 1 ... 2 3 4 5 6 ... 16 Next 10 Entries »