About
Randy Krum
President of InfoNewt.
Data Visualization and Infographic Design

Infographic Design

Infographics Design | Presentations
Consulting | Data Visualizations

DFW DataViz Meetup

Join the DFW Data Visualization and Infographics Meetup Group if you're in the Dallas/Fort Worth area!

Search the Cool Infographics site

Custom Search

Subscriptions:


Feedburner

The Cool Infographics® Gallery:

How to add the
Cool Infographics button to your:

Cool Infographics iOS icon

- iPhone
- iPad
- iPod Touch


Read on Flipboard for iPad and iPhone

Featured in the Tech & Science category

Flipboard icon

Twitter Feed
From the Bookstore

Caffeine Poster

The Caffeine Poster infographic

Entries in treemap (14)

Monday
May052008

Where Does the Money Go?


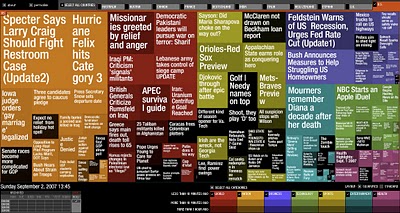
From the nytimes.com, this graphic visually represents how average consumer spending breaks down, and the color code shows how much spending in that category has changed in the last year. For example, Gasoline is 5.2% of an average consumer's spending, and it has risen 26% from 2007 to 2008.

As far as I can tell, this is actually a treemap, but in a new shape. More details pop-up when you mouse over each of the individual shapes.

Thanks to Tony, for sending in the link.

Monday
Apr142008

Treemaps for drive space

I don't think I've posted much about specific software programs, but there are a number of infographic programs that anyone can use. These two are programs that analyze what's on your hard drive, and show it you in a treemap display.

The one above is Disk Inventory X for the Mac (which I use), and the one below is WinDirStat for Windows. Both are free, and are real-life examples of how you can use infographics in your life. So take a minute, and clean off some of that old junk taking up space on your hard drive.

Wednesday
Sep052007

Marumushi News Map


Marumushi.com has a fantastic News Map using the treemap visualization style. This is one of the best implementations of a treemap that I have found. Updated every 6 hours, it groups news stories (from the Google news aggregator) by overall category (technology, world, sports, etc.). You can choose to show the news map from 11 different countries, and the color shading of each block represents how old that particular news story is. Hovering your mouse over any square shows the whole title, and clicking takes you directly to the story.

Saturday
Aug252007

Consumer Spending (5% on Tech Stuff)


From Wired magazine (issue 15.08) a treemap infographic of consumer spending in 2005. 5% of all consumer spending was on technology, and of course, Wired broke down that 5% into an expanded treemap.

Internet access +216%, Residential phone -25%. VOIP seems to be making an impact.

Page 1 2