6 Twitter Topic Visualizations for "Caffeine Poster"
The Caffeine Poster got a huge amount of traffic, specifically on Twitter, so I thought this would be a good chance to share a collection of the available, interactive twitter visualizations. Although there are many visuals that show a Twitter user’s network of connections, these are visualizations that show conversations based on the search topic “caffeine poster” on Twitter.
SocialCollider.net, by Karsten Schmidt and Sascha Pohflepp, maps the connections within a conversation starting with a Twitter stream or search topic.
This experiment explores these possibilities by starting with messages on the microblogging-platform Twitter. One can search for usernames or topics, which are tracked through time and visualized much like the way a particle collider draws pictures of subatomic matter. Posts that didn’t resonate with anyone just connect to the next item in the stream. The ones that did, however, spin off and horizontally link to users or topics who relate to them, either directly or in terms of their content.
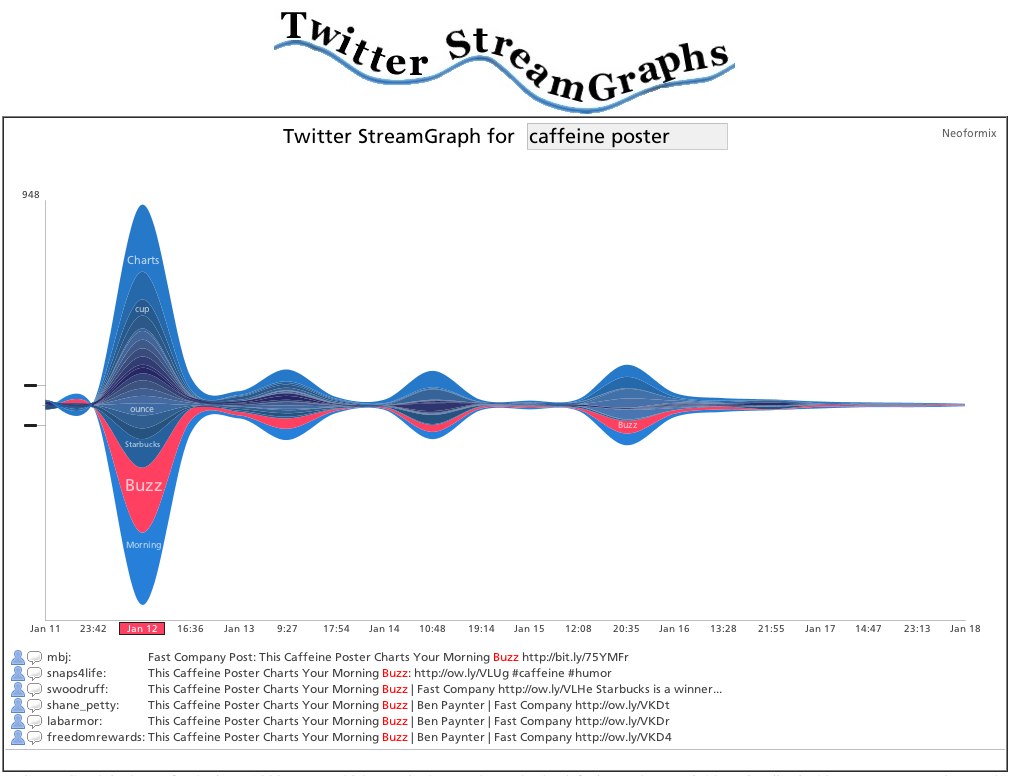
The Twitter Streamgraph from Jeff Clark at Neoformix.
The StreamGraph shows the usage over time for the words most highly associated with the search word. One of these series together with a time period are in a selected state and coloured red. The tweets that contain this word in the given time period are shown below the graph. You can click on another word series or time period to see different matches. In the match list you click on any word to create a different graph with tweets containing that word. You can also click on the user or comment icons and any URL to see the appropriate content in another window. If you see a large spike in one time period that hides the detail in all the other periods it will be useful to click in the area to the left of the y-axis in order to change the vertical scale.
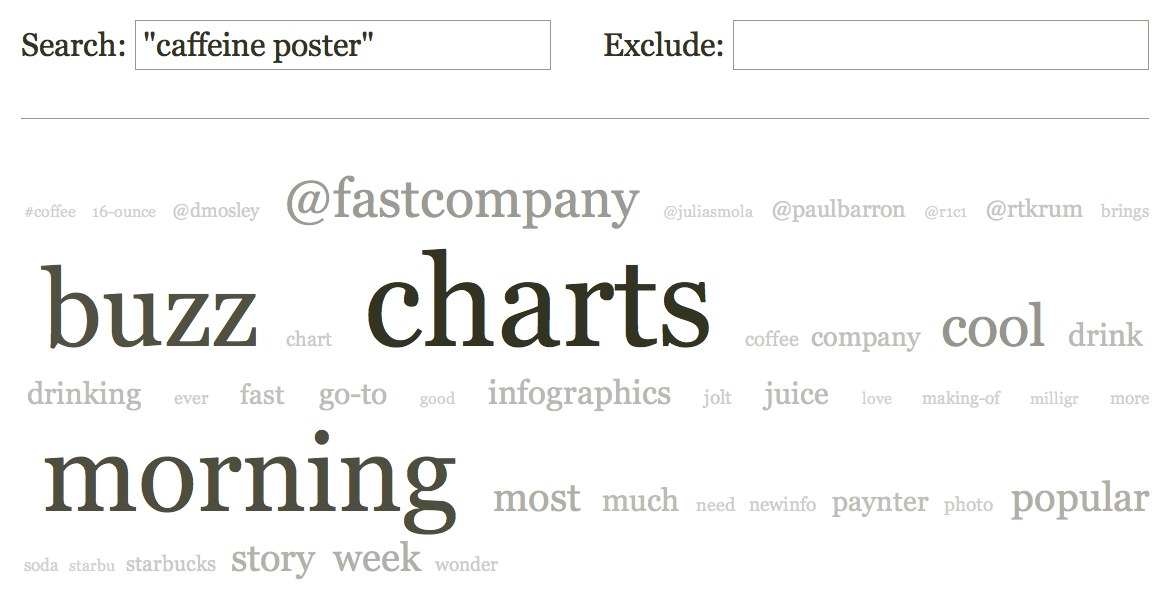
Cloud.li, by Elbert F, creates a word cloud based on your search terms.
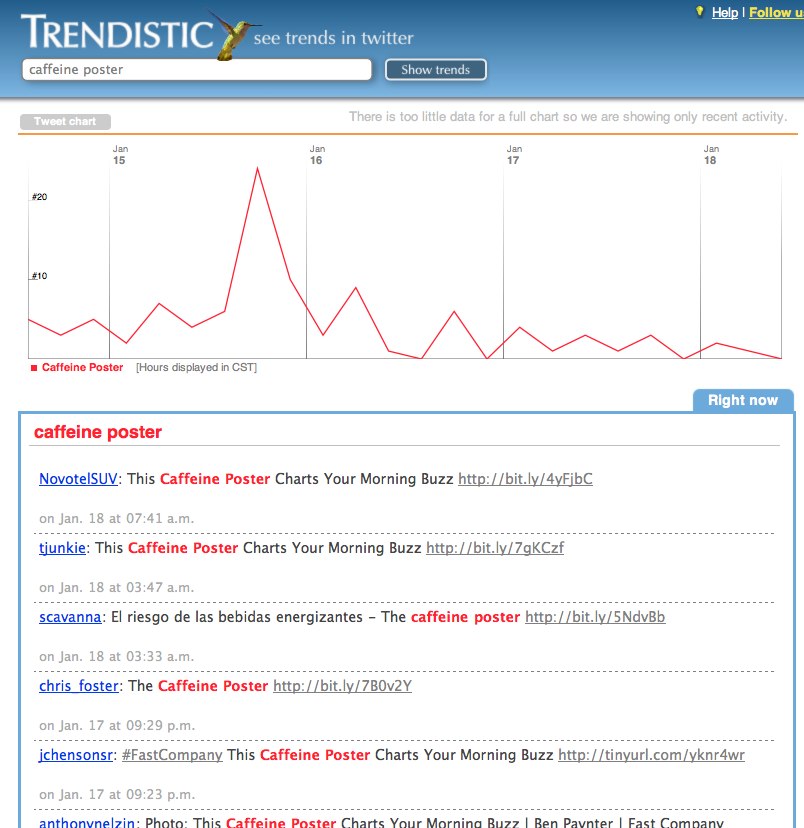
Trendistic will plot the tweet volume on a timeline based on your search terms. You can click anywhere on the timeline to see the specific tweets for that time too.
Trendistic is a tool that allows you to track trends on Twitter, similarly to what Google Trends does for Google searches. It gathers tweets as they are posted, filters redundant ones and compiles the rest into one-hour intervals.
This way, it shows how the frequency of one, two, three and four-word phrases fluctuate over time. The result is a visualization of what is popular and what is not among Twitter users, and how certain events are reflected or even predicted by themicroblogosphere.
You can enter a phrase (topic) in the Trendistic search box to see how its frequency varies over time, or several different topics separated by commas to see how they relate (each topic will show in the chart with a specific color): try comparing ‘dinner’ and ‘breakfast’ or ‘morning’ and ‘night’ for instance, to see how powerful it can be.
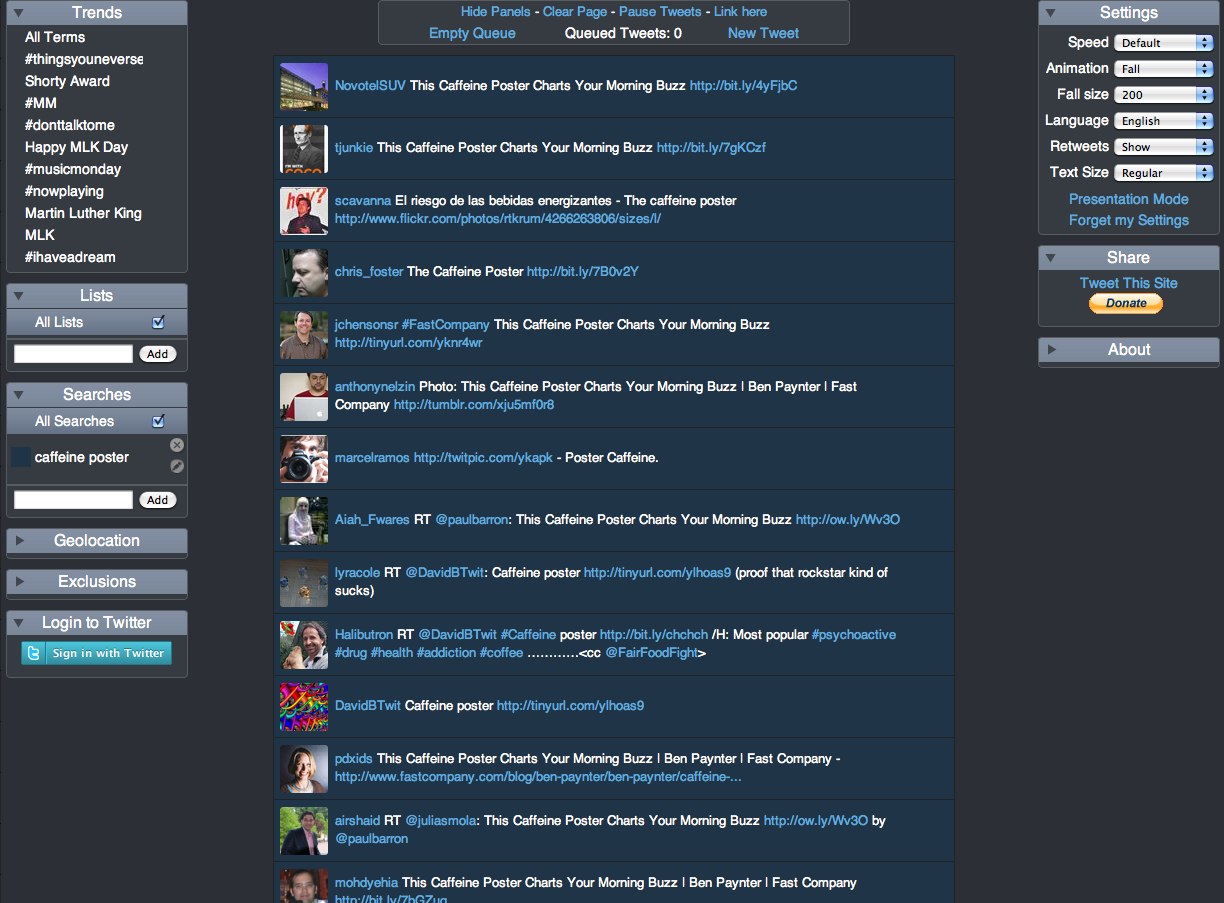
TwitterFall shows you the tweets based on your search term, and presents them as an animated waterfall.
Twitterfall is a way of viewing the latest ‘tweets’ of upcoming trends and custom searches on the micro-blogging site Twitter. Updates fall from the top of the page in near-realtime.
For popular trends, Twitter is queried from the Twitterfall server, and results arepushed to your browser, rather than your browser doing the queries, or your computerpolling our server repeatedly. This means using Twitterfall for popular trends is nicer on Twitter than other services.
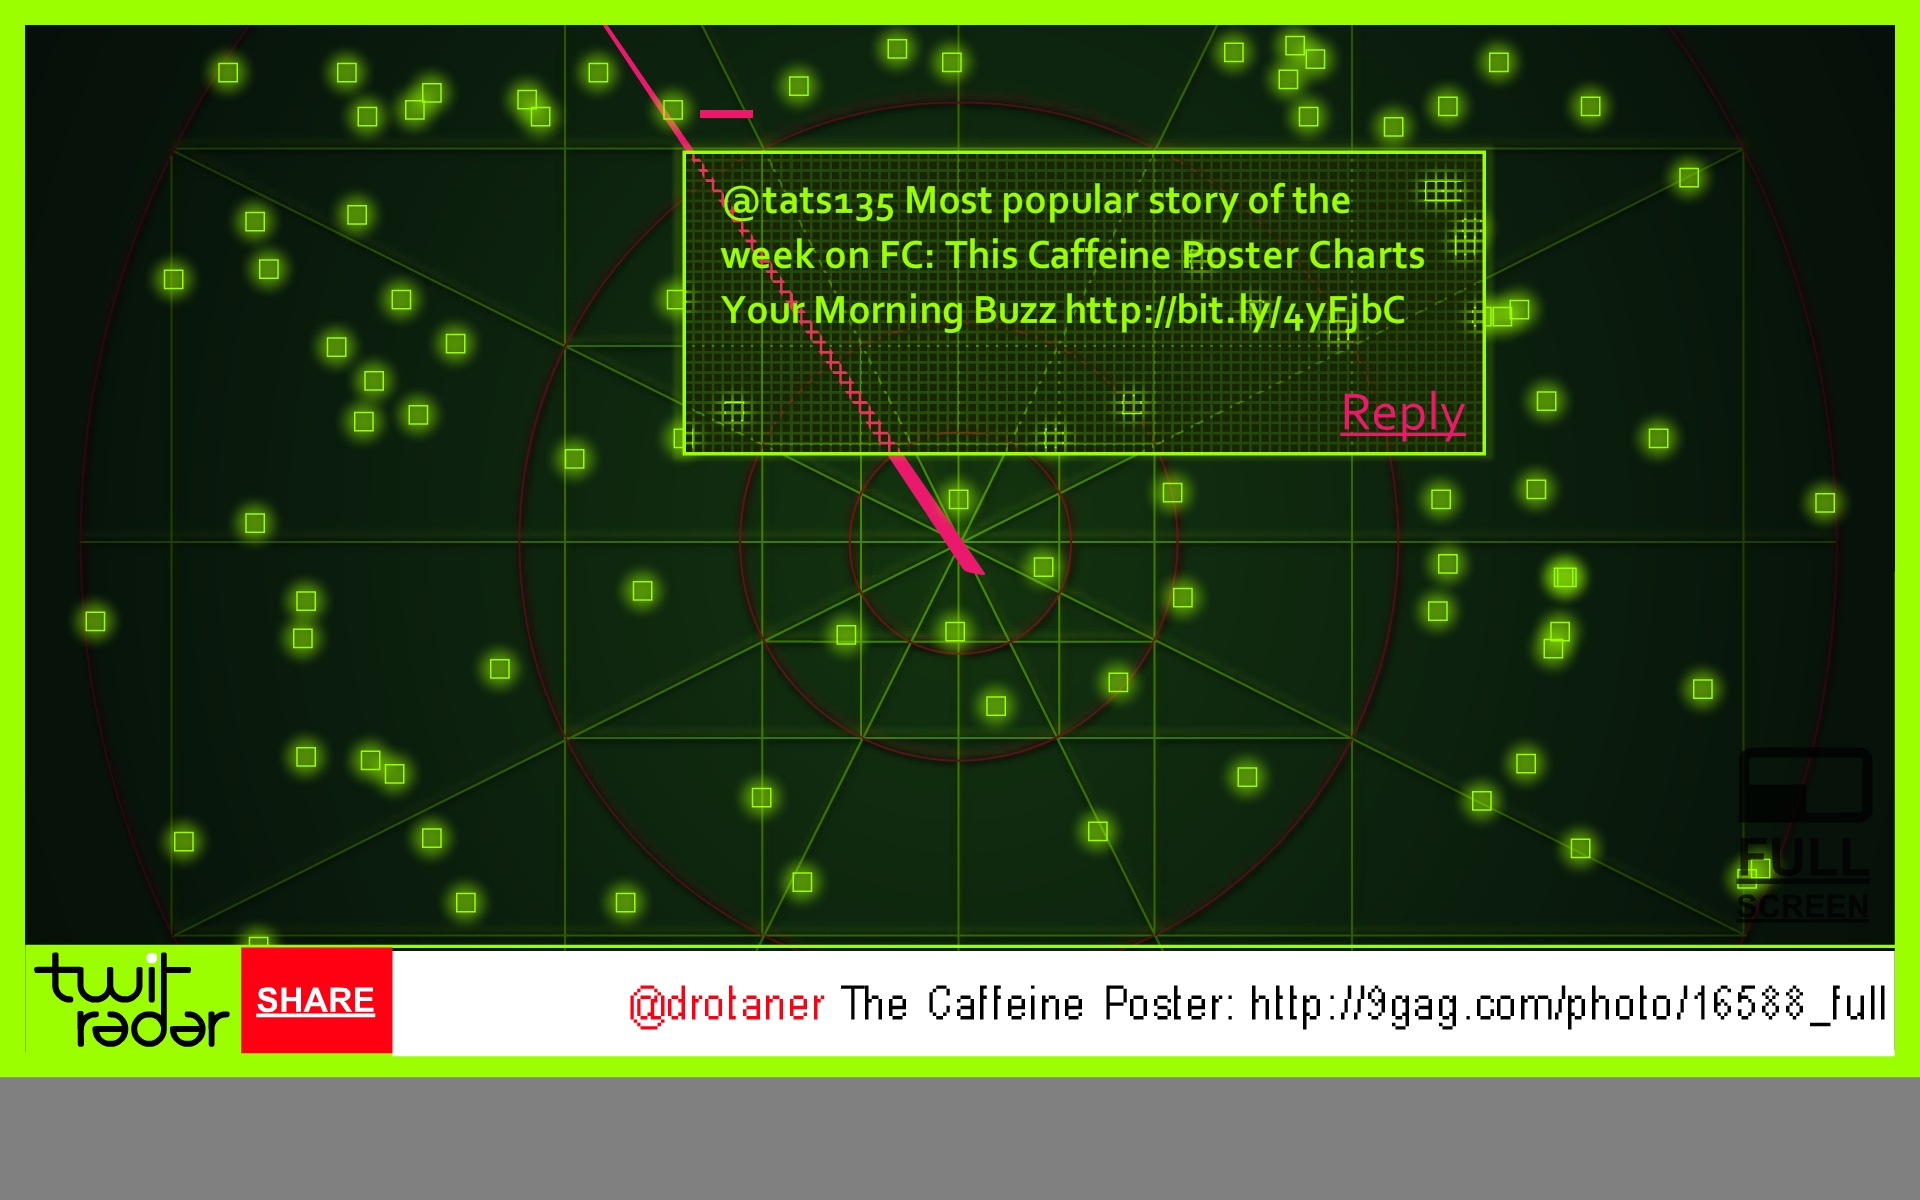
TwitRadar.com will map out a search term, a user or a hastag into a handful of different visuals.
Google Translated from Portuguese: The TwitRadar is a tool for monitoring Twitter. With TwitRadar you can track, monitor and share real-time, the subject you want. Just type the tag you want to track, the TwitRadar show, very simple and intuitive, all that is written about it on Twitter. And not to be confused with the volume of information tracked, the TwitRadar organizes the results according to the criteria that you want.


 Randy
Randy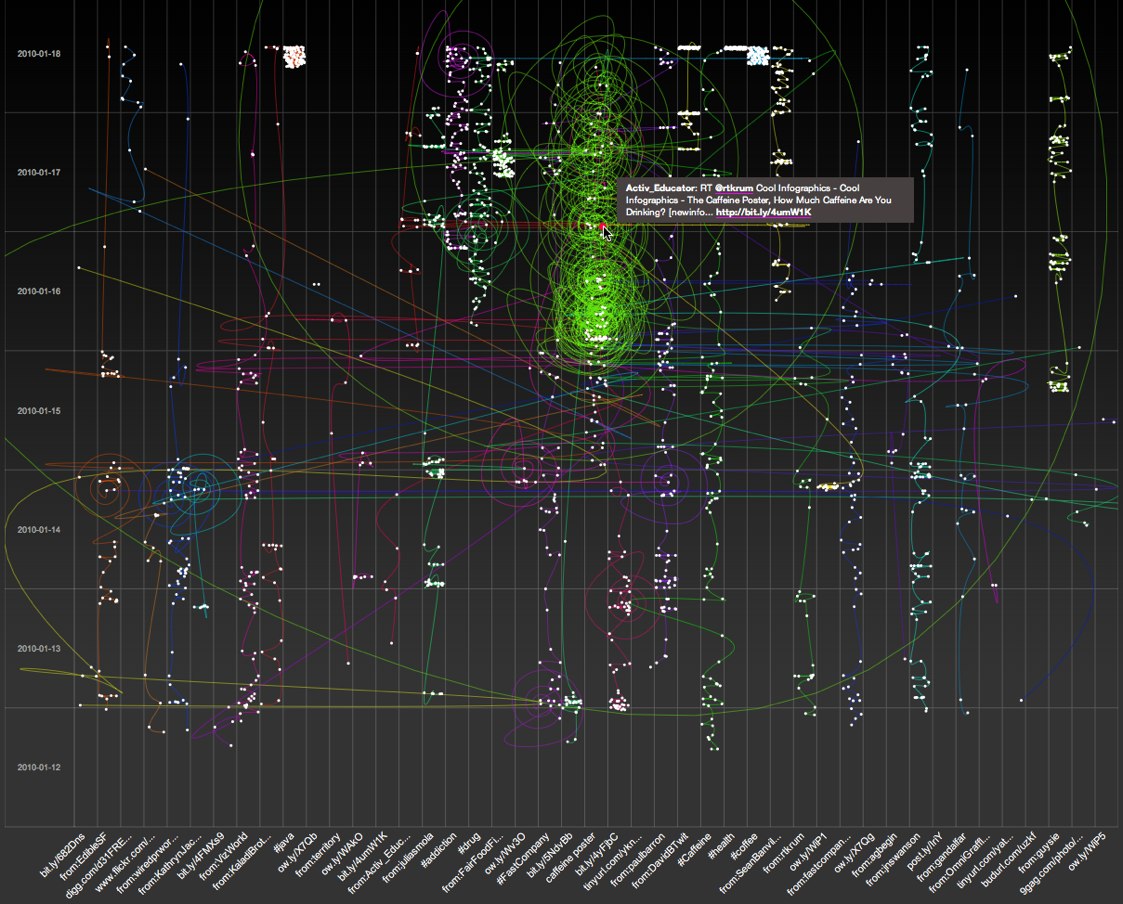

Reader Comments (2)
Introducing myself. Have a Sign Factory in Los Angeles. Been lurking around watching you guys. You are awesome. Hope to fit in. Trying to learn all I can. Thanks in advance for the help I'm sure I'll need.
- John
Channel Letters
Very nice to meet u in this point
My real eminence is Shan Grunwald ^^
Sharing is off colour, right?