


Circular Browser Statistics using Axiis
 Randy
Randy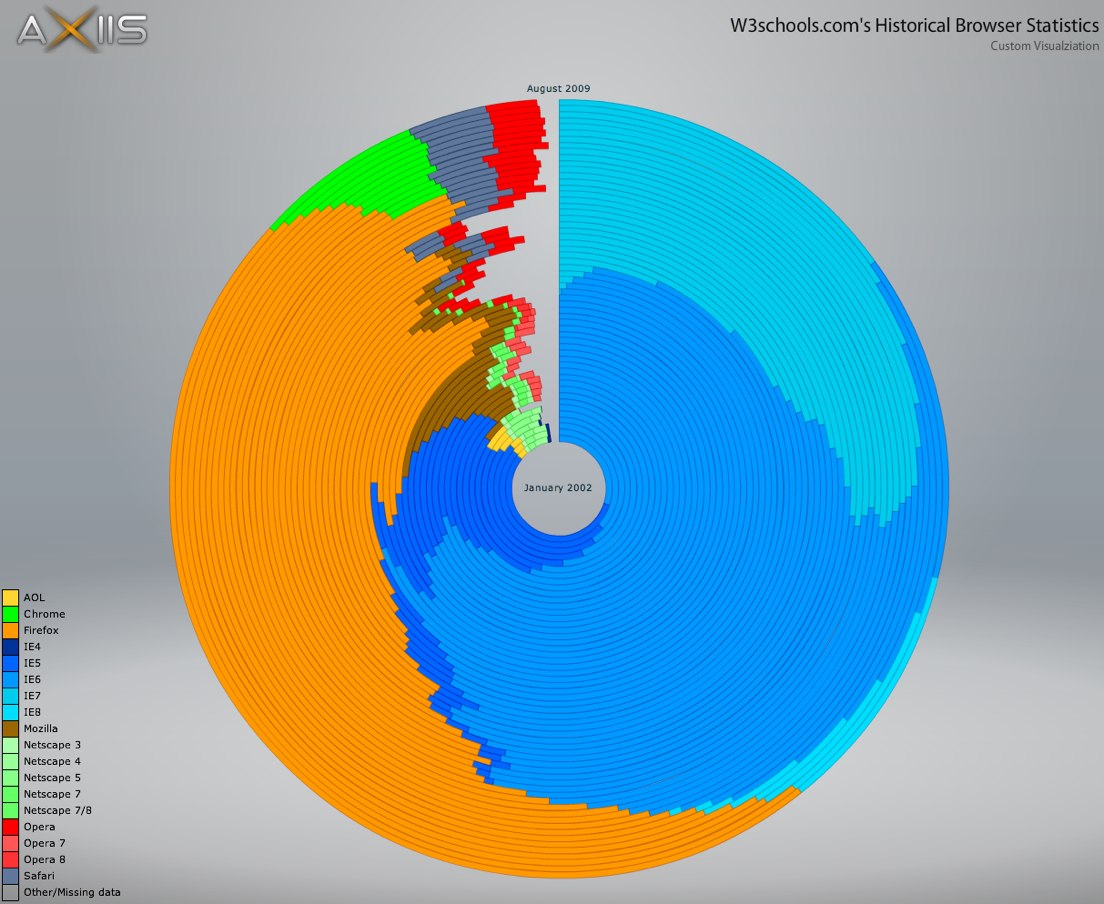
Michael VanDaniker posted this Historical Browser Statistics visual as part of the launch of Axiis, including the detail about what it took to develop this visual. At its root, this is a timeline that starts at the center (January 2002) and works outward to the outer ring that represents the most recent time slice (August 2009). Each ring is a stacked bar showing the portion of browser usage.
Each of the concentric rings are essentially pie charts showing the percentage of visitors using each browser for a particular time slice, starting with January 2002 in the center and working out to August 2009. The numbers on W3schools.com don’t quite add up to 100% because they don’t report on browsers that make up less than 0.5% of their visitors. This results in a gap at the end of each ring.
I don’t know much about Axiis (yet…), but its a new, open source framework for data visualizations.
Thanks to Les (@lesjames on Twitter) for the link!

Reader Comments (6)
Is it just me or does the orange color representing Firefox make this graph look just like the Firefox logo???
It's not just you. It does seem to resemble the Firefox logo.
Looking at any one bar I can't really tell:
A) what the date is because there is no "pattern". all months are included for 2008 and 2009 but that is not true for 2002-2007.
B) what percentage of the (incomplete) circle that bar represents.
Sure, I can mouse over the interactive version and find these two pieces of data. But looking from a macro perspective, how am I supposed to pick which bars I want to mouse over in the first place?
There are some pretty big problems with the applicability of the chosen charting method to the data, eg. 25% of the outer ring is considerably bigger than 25% of the inner ring; it grossly exaggerates the rate of change. Also W3C schools isn't a great place to look for browser stats because their sample is based on visitors to their own site so is skewed towards the webdev communityfurther exaggerating the speed of Firefox's growth.
That said, axiis looks like it might be a nice toolkit as always the quality/ relevance of the visualisation is in the hands of the designer rather than the tools used.
The one who built this graphic is clearly a Firefox fan. Not just because of the color choice, but also because of the way he/she chose to place the other browsers in the graph. Especially MS's IE is placed without much logic:
- IE 4 is on one side of the circle, the other IE versions on the other side
- IE 8 is not placed after IE 7 (to have 5, 6, 7, 8 in order), but before IE 6
These things make the graph look even more like the FF logo from afar. Pretty cool, but biased.
It's nevertheless an awesome representation (better than all browser charts I've seen). I only wish the author will order the IE versions correctly in the next update.