About
Randy Krum
President of InfoNewt.
Data Visualization and Infographic Design

Infographic Design

Infographics Design | Presentations
Consulting | Data Visualizations

DFW DataViz Meetup

Join the DFW Data Visualization and Infographics Meetup Group if you're in the Dallas/Fort Worth area!

Search the Cool Infographics site

Custom Search

Subscriptions:


Feedburner

The Cool Infographics® Gallery:

How to add the
Cool Infographics button to your:

Cool Infographics iOS icon

- iPhone
- iPad
- iPod Touch


Read on Flipboard for iPad and iPhone

Featured in the Tech & Science category

Flipboard icon

Twitter Feed
From the Bookstore

Caffeine Poster

The Caffeine Poster infographic

« The Ride of Your Life | Main | The Blog Tree »
Tuesday
Dec282010

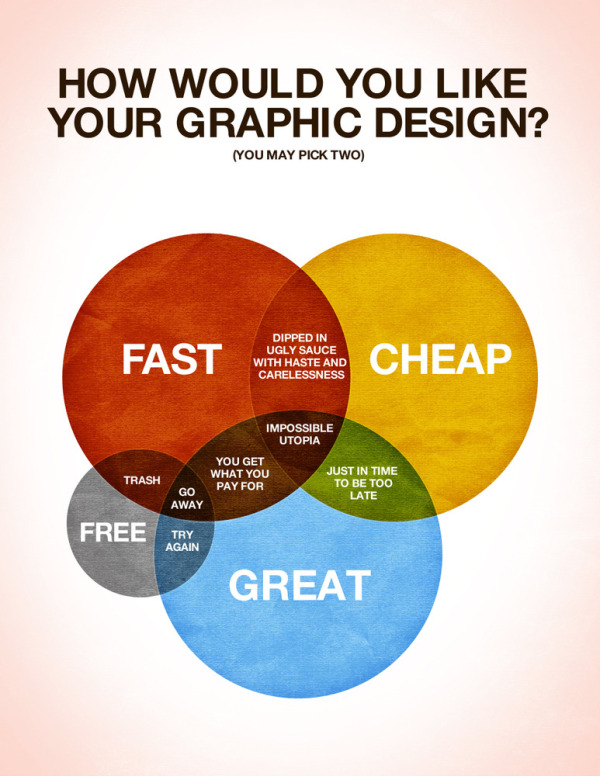
How Would You Like Your Graphic Design? #infographic


Designed by Colin Harman, How Would You Like Your Graphic Design? made me laugh this morning.  Great venn diagram infographic.

There are times when things just need to be explained using a spectacular Venn diagram. I made this last night whilst sitting on a screened in porch by an outdoor fireplace when it was late. Design is a funny thing, not as funny as a Kangaroo jumping on a trampoline, but let’s be honest what is as funny as that? I’ll give you a little hint: nothing.

Anyways, I love design, but it has it’s limitations in the creation process. Hopefully this helps you understand what those are and help you choose how you would like your design work in the future.

Your thoughts?

Although designed as a treatise about graphic design, it applies to infographics as well.

PrintView Printer Friendly Version

EmailEmail Article to Friend

Reader Comments (16)

Broken Link
December 28, 2010 | Unregistered CommenterAnanias
Fixed.

Thanks Ananias!
December 28, 2010 | Registered CommenterRandy
LOL so true.

Though as a designer I always try my best to incorporate all three in my project.
But still, generally, you always get what you paid for. :)
Heres my site: http://jillianestrellado.me
December 28, 2010 | Unregistered CommenterJill
Poster anytime soon? I would buy it.

This is not only true for graphic design, but just about anything :)
December 28, 2010 | Unregistered CommenterAni
um, can I please post this on the front page of my website? I can't think of a more clear way to explain these dynamics to clients!
December 30, 2010 | Unregistered CommenterLeigh
Thanks so much for the recognition friends, I have heard a lot of rustling about wanting a poster, I'll have you know that it is in the works and I'll be selling them soon.
Thanks again all,
.ch
January 3, 2011 | Unregistered CommenterColin Harman
I can think of a few businesses that should have one of these diagrams posted....mine for one.
January 10, 2011 | Unregistered Commenterplumber plano tx
I love the beginning graphic. It really sums things we face on regular basis in the design world.
January 16, 2011 | Unregistered CommenterTampa Web Design
Nice graphic !
January 18, 2011 | Unregistered Commenterseotons
Any of you who are interested in a print of this: http://colinharman.bigcartel.com
January 24, 2011 | Unregistered CommenterColin Harman
As much as I agree with the general direction of your message, if you are asking for a genuine opinion: Infographics fail. A venn diagramm is the wrong visualisation for the variables the author means to express. Introducing yet another variable into the widely recognized triangle of forces of information retreival (wait, why is free not the utmost extreme position of cheap?) does no good either. Then again, from a meta perspective, if this graphic was designed on a tight budget without any time whatsoever: Epic win. The joke's on me for not getting the irony.
January 30, 2011 | Unregistered CommenterJakob
I will upsize and have frys with my Graphic Design please!
January 31, 2011 | Unregistered CommenterChris Howell
your post is insightful and hilarious both
The Truth can be both painful and funny all at once.
February 3, 2011 | Unregistered CommenterLeona
Poster needed! Large enough for customers to read it off the wall.
February 11, 2011 | Unregistered CommenterIrina
Nice thought about infographic. I've tried that way and it works sometimes.

Anthony & Tim Buchalka
February 24, 2011 | Unregistered CommenterAnthony
Comments for this entry have been disabled. Additional comments may not be added to this entry at this time.