About
Randy Krum
President of InfoNewt.
Data Visualization and Infographic Design

Infographic Design

Infographics Design | Presentations
Consulting | Data Visualizations

DFW DataViz Meetup

Join the DFW Data Visualization and Infographics Meetup Group if you're in the Dallas/Fort Worth area!

Search the Cool Infographics site

Custom Search

Subscriptions:


Feedburner

The Cool Infographics® Gallery:

How to add the
Cool Infographics button to your:

Cool Infographics iOS icon

- iPhone
- iPad
- iPod Touch


Read on Flipboard for iPad and iPhone

Featured in the Tech & Science category

Flipboard icon

Twitter Feed
From the Bookstore

Caffeine Poster

The Caffeine Poster infographic

« Visualizing the links between the WIG20 | Main | Interactive 2010 FIFA World Cup Game Tracker »
Wednesday
Jun302010

Google(graphic) - How Google Works


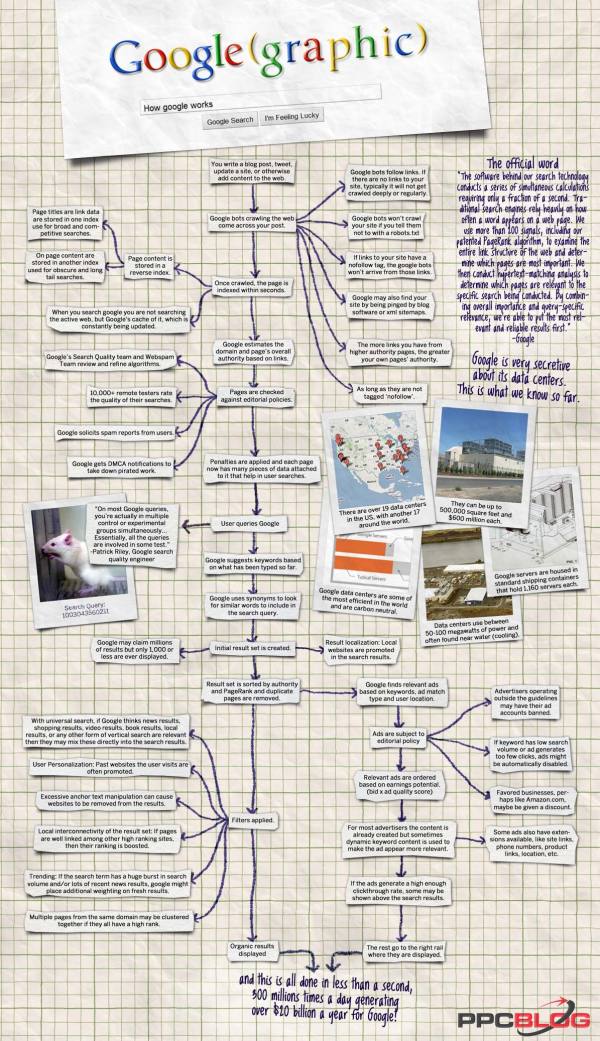
PPCblog.com brings us the Google(graphic) flowchart that documents what happens in the fraction of a second after 300 million people press the Search button every day.  Created by infographic designer Jess Bachman at WallStats.com.

So here is my latest infographic, hot off the press.  How Google Works.  It’s a flow type chart that diagrams the process of how google gets it data and what happens in the second after you search.  It’s a $20 billion a year process for google, and pretty interesting.

PrintView Printer Friendly Version

EmailEmail Article to Friend

Reader Comments (4)

500 million not 500 millions

July 1, 2010 | Unregistered CommenterTom

Great information. Thanks for sharing. i really need this topic
What is Bounce Rate?

July 4, 2010 | Unregistered Commenterjoshep_marck_don

Google Good! Support!

July 4, 2010 | Unregistered Commenter万众网址导航

非常好!

July 16, 2010 | Unregistered Commenter党岩
Comments for this entry have been disabled. Additional comments may not be added to this entry at this time.