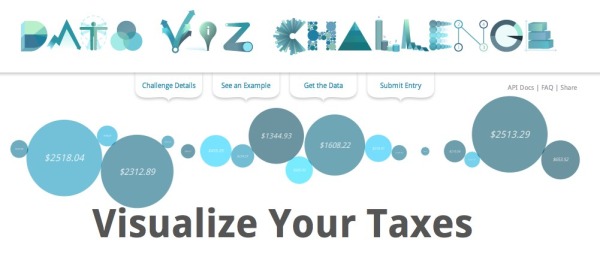
Google Data Viz Challenge: Visualize Your Taxes
Google has partnered with Eyebeam to sponsor the Data Viz Challenge: Visualize Your Taxes using data provided by WhatWePayFor.com. I really like the data viz styles used as a font, similar to the Goole Doodles.
Every year, Americans fill out income tax forms and make a payment to the IRS. It’s an important civic duty, but it is also a lot of money. Where does it all go? Using data provided by WhatWePayFor.com, we challenge you to create a data visualization that will make it easier for U.S. citizens to understand how the government spends our tax money.
The Prize: $10,000 in prizes with $5,000 for the top entry. Winning entries will featured on the DataVizChallenge.org website, the Official Google Blog, Eyebeam.org and Fast Company’s design blog, Co.Design.
The Deadline: Submit your entries by midnight of March 27, 2011. Finalists will be announced the week of April 11, and winners will be publicly announced on Tax Day (April 18, 2011).
Participants must be residents of the U.S., which is an issue for many would-be designers.
Found on Infographics News, VizWorld and Infosthetics


 Randy
Randy
