


The Health Benefits of Guinness vs. Beer
 Randy
Randy
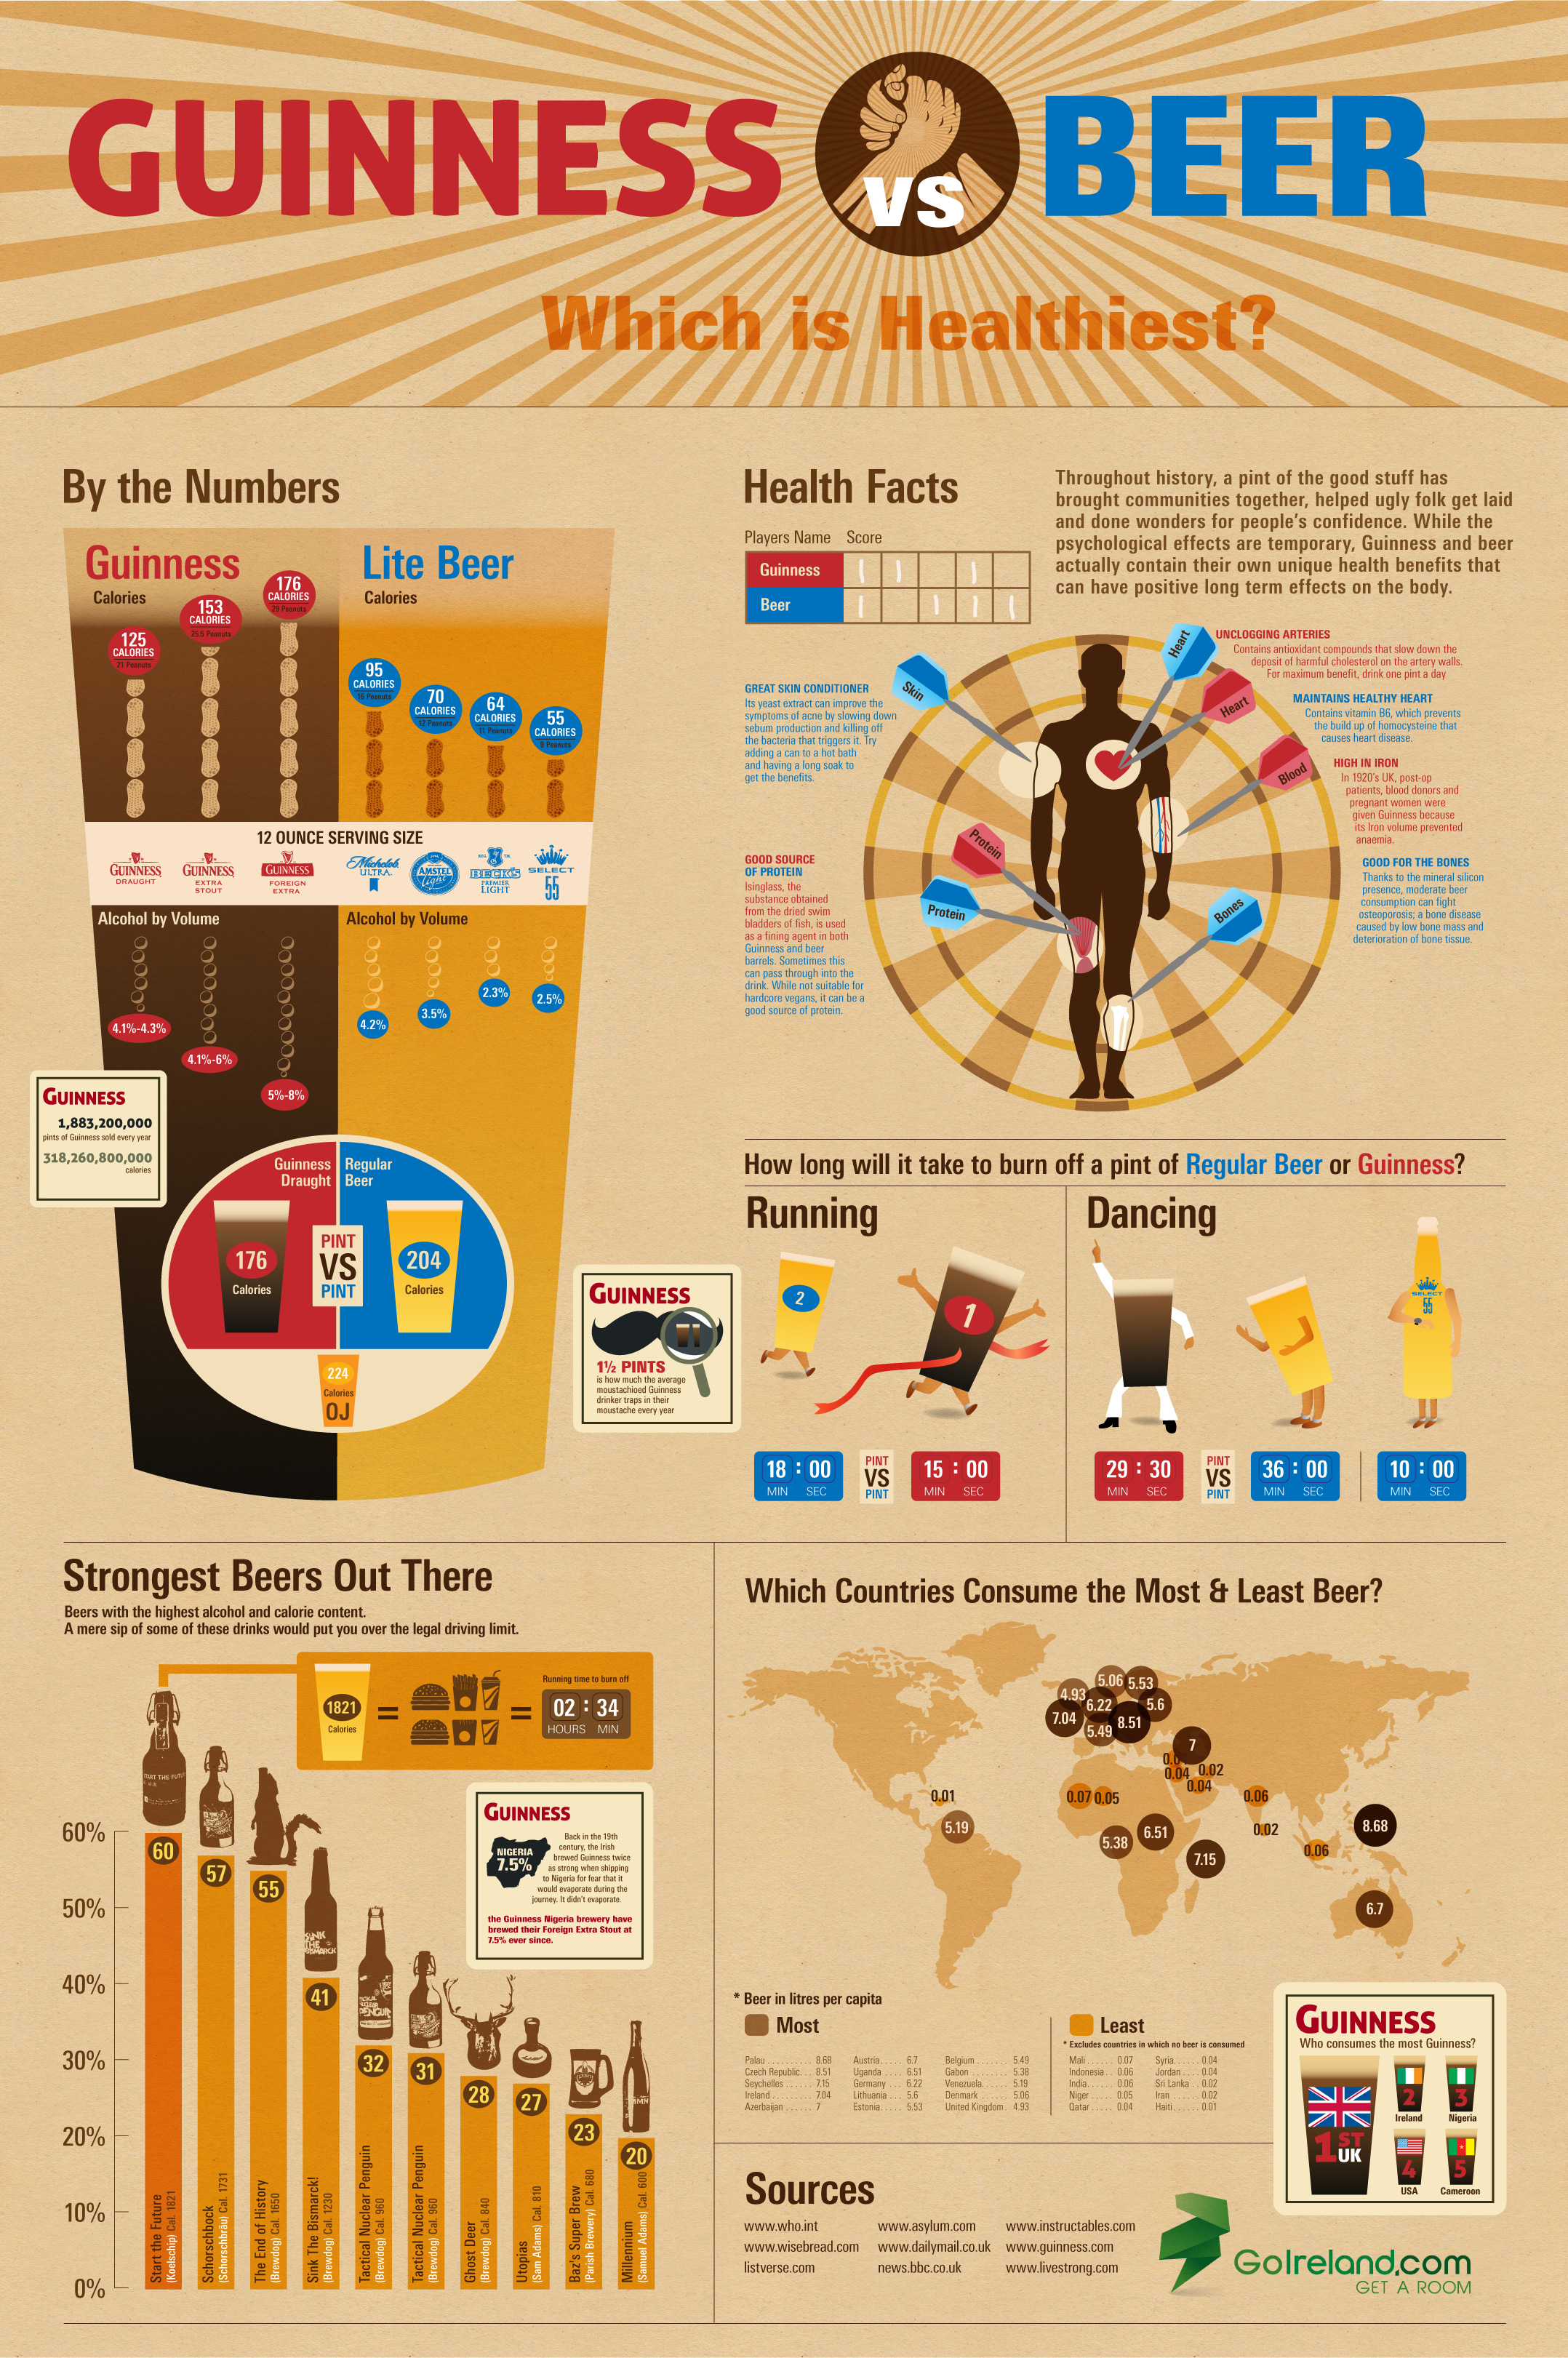
The Health Benefits of Guinness vs. Beer is a new infographic from the team at GoIreland.com. Primarily focused on calories, this infographic does a good job at visualizing comparisons.
We at GoIreland have rustled up a useful infographic about Guinness and other beers. But not just any infographic about booze. We recognize that folks in the 21st century are more health conscious than ever, so have combined these two facets to look at the health benefits of Guinness vs. other types of beer.
Whether you enjoy the dark stuff, or lean towards lager, the results show that a pint of one, or the other, can have positive effects on various areas of the body, such as the heart, bones and even your skin. Through painstaking research, we even worked out how many individual peanuts each drink is the equivalent to eating, how long it would take to burn off those calories and taken a look at some of the strongest beers known to mankind.
This infographic is really well designed, and it’s focused on one of my favorite drinks in the world! The visual comparison between Guinness and a handful of light beers is clear and easy to read. However, when they start comparing to “Regular Beer” it’s unclear what brand they are using as the average beer and where that data comes from. I like the Running and Dancing comparisons that are fun and make understanding the differences easier to an average reader.
The only visualization error I see is the circles on the world map. Circles have to be sized by their AREA, so if we assume the Ireland circle is the correct baseline, then the circles for values of 0.06 and 0.02 would only be a couple pixels wide. The circles in the design are shown larger than their actual values, which is a false visualization.
At the bottom, I wish there was a URL to the original landing page for readers to get back to the original, and some form of copyright statement.
Thanks to Oli for sending in the link!
Here is an alternate, shorter and in my opinion “better” version. What do you think?

Reader Comments (4)
1. "Alcohol by Volume" in the lower half of the "glass" image: The reversal confused me. The top half of the glass was "higher is better", and then we switch to "lower is better". At first and second glance it seemed to say: "Guiness is less calories, but that's because it's lower in alcohol". Took me almost 10 seconds to realized the metric was "farther from the line of logos is better".
2. "Pint vs Pint" it took 3 readings to realize they are not comparing the Guiness vs the Lite Beer (which was what they were talking about so far) but about a new 3rd party: "Regular beer". It was confusing, and seemed to contradict the number of calories in the chart above.
3. "Health Facts" it was a little confusing that there are 5 possible "targets" but 6 paragraphs. I suppose it was good for layout, but it's inconsistent.
4. "Dancing": again, we have this odd 3rd party that shows up. Making it not obvious at first glance which of the yellow beers is what.
5. "Strongest Beer Out There": I start at the top, and see that there's a number in an ellipse. And it's explained to be "calories". Right after it in the chart, I assume that still holds. Oops, no. There's text that says "Cal 1827", which I guess means Calories (or kilo-calories), so the number in the ellipse in the bars must be the alcohol by volume.
Still despite all the confusion, I think it's a really fun and nice infographic. I just had a hard time getting real information out of it.
It has High iron content, High vitamin B, Lower calories than many other beers (just 125 per 12 oz) and also Proven benefits to lowering blood clots.