About
Randy Krum
President of InfoNewt.
Data Visualization and Infographic Design

Infographic Design

Infographics Design | Presentations
Consulting | Data Visualizations

DFW DataViz Meetup

Join the DFW Data Visualization and Infographics Meetup Group if you're in the Dallas/Fort Worth area!

Search the Cool Infographics site

Custom Search

Subscriptions:


Feedburner

The Cool Infographics® Gallery:

How to add the
Cool Infographics button to your:

Cool Infographics iOS icon

- iPhone
- iPad
- iPod Touch


Read on Flipboard for iPad and iPhone

Featured in the Tech & Science category

Flipboard icon

Twitter Feed
From the Bookstore

Caffeine Poster

The Caffeine Poster infographic

« Zombies vs. Mobile Storage Containers | Main | An Infographic Profile of the Modern Travel Blogger »
Friday
Oct112013

xkcd - Tall Infographics

xkcd - Tall Infographics

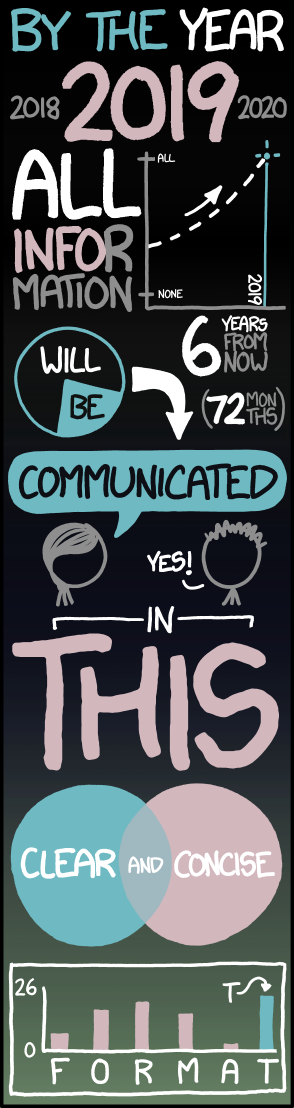
The Tall Infographics design from Randall Munroe at xkcd literally made me laugh out loud.  As he mentions in the text:

“‘Big Data’ doesn’t just mean increasing the font size.”

Very similar to something I repeat here on Cool Infographics all the time.  “Big fonts are not data visualizations!”

However, the format of the Tall Infographic is here to stay.  The tall format fits nicely in the content area of most websites and blogs, and the user experience of scrolling vertically is much easier than scrolling horizontally.

Found on Gizmodo and Stats Chat

PrintView Printer Friendly Version

EmailEmail Article to Friend

Reader Comments (2)

What a great content you have on your website. It's really interesting.
October 11, 2013 | Unregistered CommenterJoanna
Really good website this is, full of useful information and advice. Thanks for sharing.
December 25, 2013 | Unregistered CommenterAlforno
Editor Permission Required
While we are migrating to a new site design, you must have editing permission for this entry in order to post comments.