About
Randy Krum
President of InfoNewt.
Data Visualization and Infographic Design

Infographic Design

Infographics Design | Presentations
Consulting | Data Visualizations

DFW DataViz Meetup

Join the DFW Data Visualization and Infographics Meetup Group if you're in the Dallas/Fort Worth area!

Search the Cool Infographics site

Custom Search

Subscriptions:


Feedburner

The Cool Infographics® Gallery:

How to add the
Cool Infographics button to your:

Cool Infographics iOS icon

- iPhone
- iPad
- iPod Touch


Read on Flipboard for iPad and iPhone

Featured in the Tech & Science category

Flipboard icon

Twitter Feed
From the Bookstore

Caffeine Poster

The Caffeine Poster infographic

« Water in the Anthropocene | Main | Wireframe, Prototype and Simulator Tools »
Wednesday
May292013

Robin Richards - What Makes an Infographic Cool?

Guest Post by Robin Richards

Created a visual to show you instead of telling you.  Some thoughts on what makes an infographic cool along with some examples.

Robin Richards - What Makes an Infographic Cool?

Robin Richards

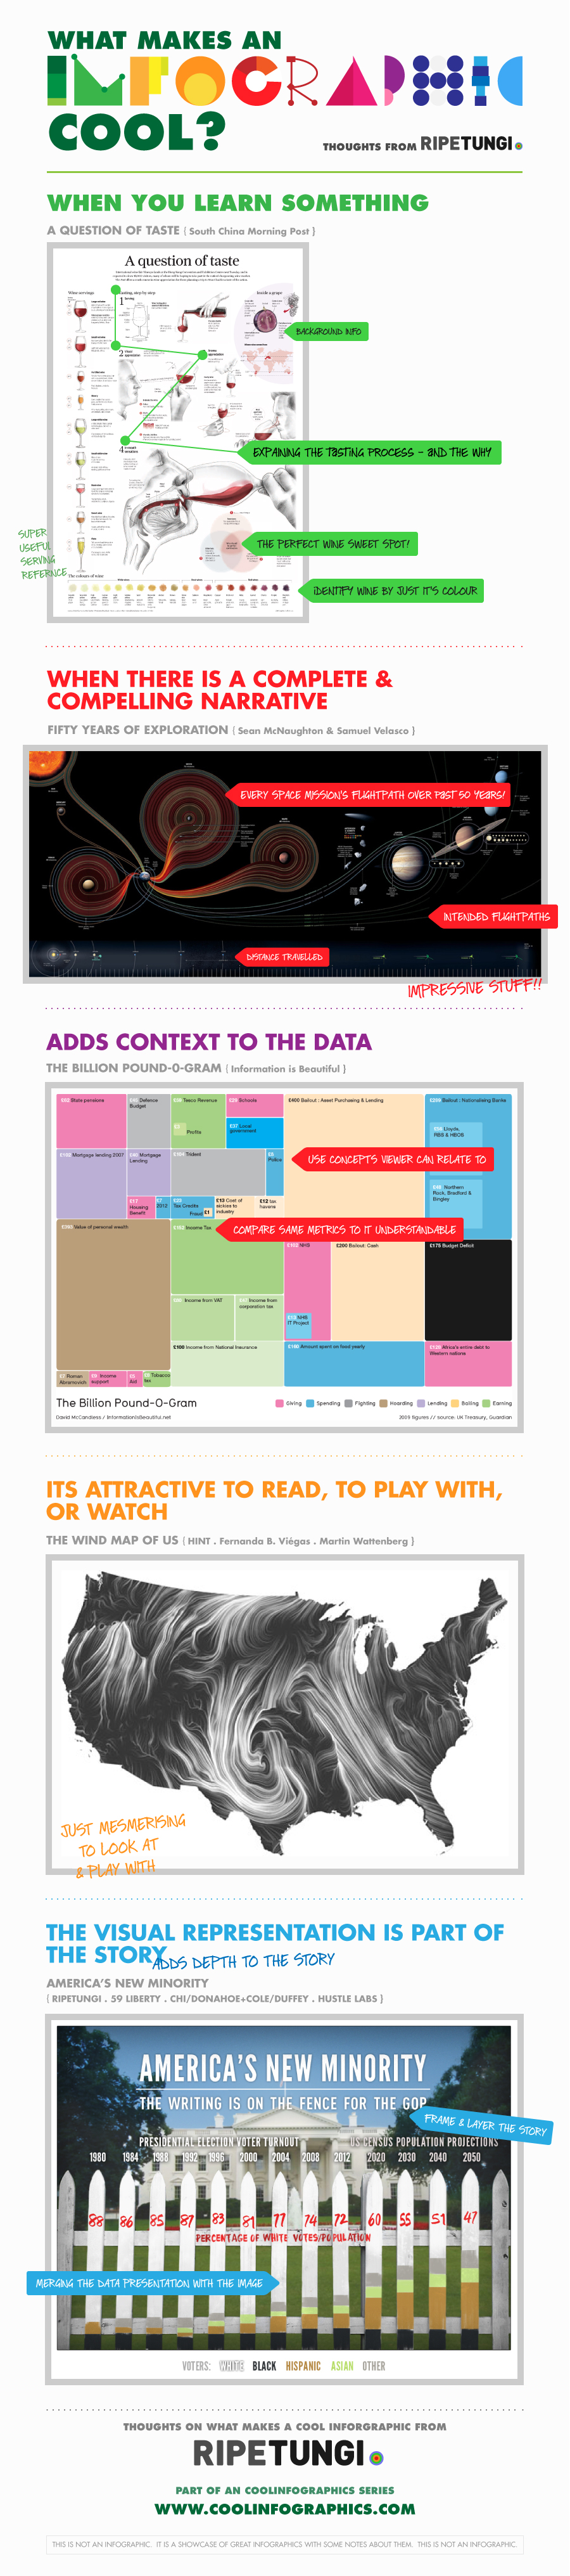
Robin Richards is a designer with a focus on visual storytelling and interaction design. He runs RIPETUNGI, a design studio based in Bristol, UK creating digital experiences for web, mobile and tablet and telling stories with data visualisation and infographics. 

LINKS:

ripetungi.com

Twitter: @ripetungi

LinkedIN: http://uk.linkedin.com/pub/robin-richards/2a/262/147

PrintView Printer Friendly Version

EmailEmail Article to Friend

Reader Comments (2)

No typos . . . "An CoolInfographics series . . ."
May 30, 2013 | Unregistered CommenterNick Cobb
Nice..........
Editor Permission Required
While we are migrating to a new site design, you must have editing permission for this entry in order to post comments.