


Matt Siltala - What Makes an Infographic Cool?
 Randy
RandyGuest Post by Matt Siltala
“Cool” infographics effectively build links, drive social shares, and create buzz in a unique way. There are many that would call infographics a “fad” or “tactic”, but I don’t think of infographic marketing so much as a tactic, but more of one important piece to an overall marketing puzzle.
I analyze a lot of infographics and find that those that catch my attention have also caught the attention of many others, and that ‘s reflected in the social mentions (specifically retweets). You’ll typically see a correlation in the number of shares on Facebook, the links built, and especially the comments. The comments are very telling!
I guess that answer was more about the results of the infographic, rather than the makeup of the infographic, so let’s talk about the makeup:
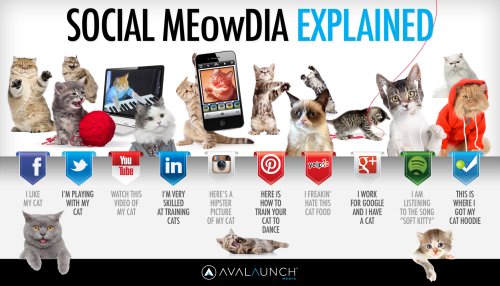
- Design - Is the design distracting or does it build the story? Is the design unique, new and refreshing? How clean and easy to read and follow graphic? With so many graphics out there, you have to find a way to visually set yours apart without detracting from the story you’re selling. The graphic does not always have to be a LONG vertical piece that we are used to seeing in this industry. You can see from our “Social MeOWdia Explained by Cats” piece, the design was critical to show everything right there without scrolling, so it does a better job of telling the story.
- Story - Does the graphic tell a story? In my opinion this is probably the most important thing to get right with an infographic. You must set reader hooks that are easy to understand and that set firmly and early on. Having a good opener and intro makes all the difference in the world. This is where you capture your reader. You can now move into all of those juicy stats and data that really build the story out.
- Flow - How does the graphic flow? This is an area where a lot of infographic designs fall short. They have a hard time visualizing flow without becoming overly wordy. Your visuals should transcend words whenever possible.
- Data - How striking is the data? The key here is to have information that is both fresh and relevant. Always use up to date survey results or make your own (often times we conduct primary research through SurveyMonkey). If your graphic displays a unique set of data that can’t be found anywhere else, THIS MAKES the graphic.
- Shareability - Does it pass the “share test”? Does your graphic add meaning and perspective to a conversation people want to have? If so, it passes the share test.
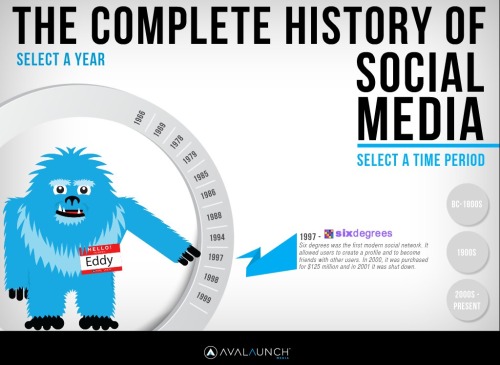
BONUS - Think about what is next in this industry. If you have the budget to make even a simple infographic interactive, you should do so. We created the “History of Social Media” piece first as a static graphic, but felt it would go over much better if it were interactive, and it did. We got many compliments on the UI, and being a friendly, easy way to learn a little history lesson. It is a great research piece for those looking up the history of social media too!
This goes back to what I said earlier about comments. If you can start or effectively add to a conversation, then you have done your job! We blogged about top notch infographics earlier this year and really hit this point in more depth if you want to read more.
I will be the first to admit I have put out some bad infographics, but the more I try to live within the walls of the 5 points above, the better my graphics get. For those of you listening to the “infographics are dead” hype, let me assure you that visualization is not going away. I have been working with infographics for the better part of a decade, long before most marketers had ever heard of them, and the majority of my new clients still don’t know what they are. My point is this, marketers see a lot of infographics just like we do linkbait and all of the other marketing puzzle pieces, but the rest of the world still finds data visualization a refreshing way to tell a story, share good content, and build brand authority.
So, if you put out conversation-starting, story-telling, “cool” infographics, the social mentions will come, the links will build, and the brand recognition will grow. That is never going to change or go away.
This post would be never-ending if I shared all of the infographics I loved out there, so for the sake of time I will just share this link to my company’s porfolio of Infographics.
 Matt Siltala is the President of @AvalaunchMedia. The company does Content Marketing, Data Visualization, Social Promotion, Web Design, SEO & PPC. Matt is also a regular Search Industry Speaker.
Twitter: @Matt_Siltala

Reader Comments (2)