About
Randy Krum
President of InfoNewt.
Data Visualization and Infographic Design

Infographic Design

Infographics Design | Presentations
Consulting | Data Visualizations

DFW DataViz Meetup

Join the DFW Data Visualization and Infographics Meetup Group if you're in the Dallas/Fort Worth area!

Search the Cool Infographics site

Custom Search

Subscriptions:


Feedburner

The Cool Infographics® Gallery:

How to add the
Cool Infographics button to your:

Cool Infographics iOS icon

- iPhone
- iPad
- iPod Touch


Read on Flipboard for iPad and iPhone

Featured in the Tech & Science category

Flipboard icon

Twitter Feed
From the Bookstore

Caffeine Poster

The Caffeine Poster infographic

« The Vizzies Challenge | Main | 12 Reasons Your Business Needs to Get Visual »
Monday
Aug112014

The State of AIDS

The State of AIDS infographic

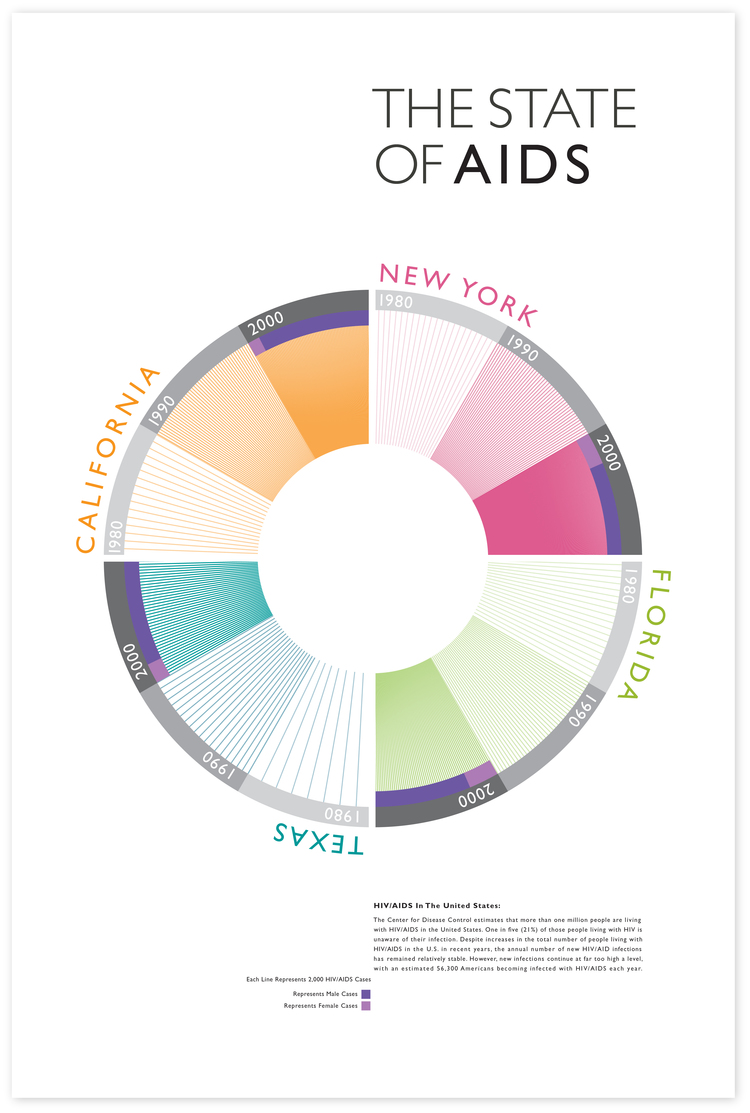
The four states in the US that have the highest number of cases of HIV and AIDS cases are California, New York, Florida, and Texas. The State of AIDS infographic shows the increase in cases from the 1980’s to the 2000’s and was designed by Alan Bui.

An Info-Graphic produced using statical reports from the CDC to represent visually the Four State in the US that have the highest cases of HIV/AID’S cases. The Info-Graph also shows disparity from the first reported case of HIV/AIDS in the 1980’s to the 2000’s.

Good data visualization that tells one story really well.  You can clearly see the number of reported cases increases dramatically each decade. 

Thanks to Alan for sending in the link!

PrintView Printer Friendly Version

EmailEmail Article to Friend

Reader Comments

There are no comments for this journal entry. To create a new comment, use the form below.
Editor Permission Required
While we are migrating to a new site design, you must have editing permission for this entry in order to post comments.