


How to Think Visually
 Randy
Randy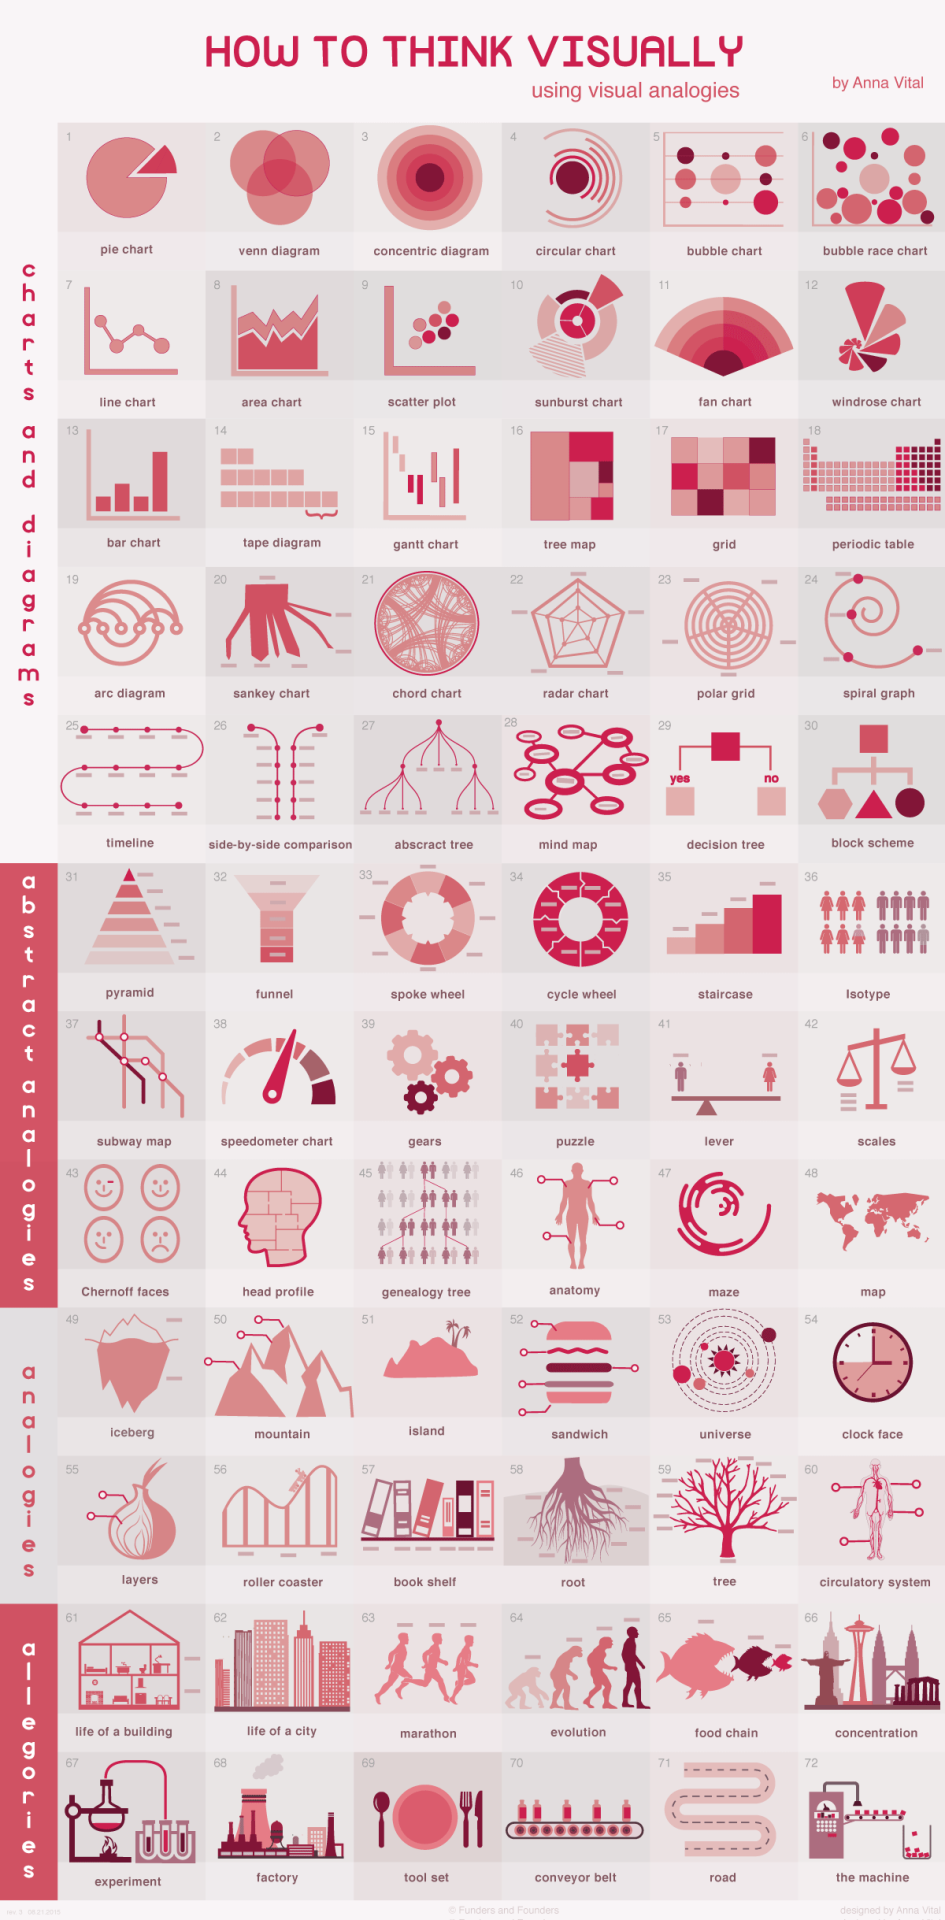
How to Think Visually Using Visual Analogies infographic from Anna Vital gives a great variety of examples for anyone to use when you create your own graphics. It begins with the most recognizable visuals, circle graphs and diagrams. Further down are abstract analogies. They are reminiscent of physical objects, but they are simplified and abstract. Next, we have regular analogies that look like the physical objects you are familiar with. The final category are allegories. These are stories, or a series of analogies. The key is that these stories are familiar enough that we don’t have to retell them, but we should analogize every part of them.
Most research in cognitive science explores how we see things but little research is done on how we understand what we see.
Understanding is the ultimate test of how good your visualization is. So how can you make people understand? Show something familiar and analogize. If you know nothing else about visualization but pick the right analogy you are more than half way there. This is what a professional designer does - and there is no substitute for analogies.
How do you choose the right analogy? In this grid I organized analogies from the abstract down to the more detailed. I grouped them by similarity in shape. The goal is to enable you to quickly see the possibilities and “try them on” your information. With time you’ll be able to do all of this in your head. But for now this is a shortcut.
As part of the infographic landing page, Anna has included a text description of each visual analogy. For the story on each graphic, read more at anna.vc
Thanks to @DR4WARD for sharing on Twitter!

Reader Comments (1)