About
Randy Krum
President of InfoNewt.
Data Visualization and Infographic Design

Infographic Design

Infographics Design | Presentations
Consulting | Data Visualizations

DFW DataViz Meetup

Join the DFW Data Visualization and Infographics Meetup Group if you're in the Dallas/Fort Worth area!

Search the Cool Infographics site

Custom Search

Subscriptions:


Feedburner

The Cool Infographics® Gallery:

How to add the
Cool Infographics button to your:

Cool Infographics iOS icon

- iPhone
- iPad
- iPod Touch


Read on Flipboard for iPad and iPhone

Featured in the Tech & Science category

Flipboard icon

Twitter Feed
From the Bookstore

Caffeine Poster

The Caffeine Poster infographic

« Why Do Businesses Fail? | Main | Divergent Realities: The Difference Between 'VR' and 'AR' »
Wednesday
Nov292017

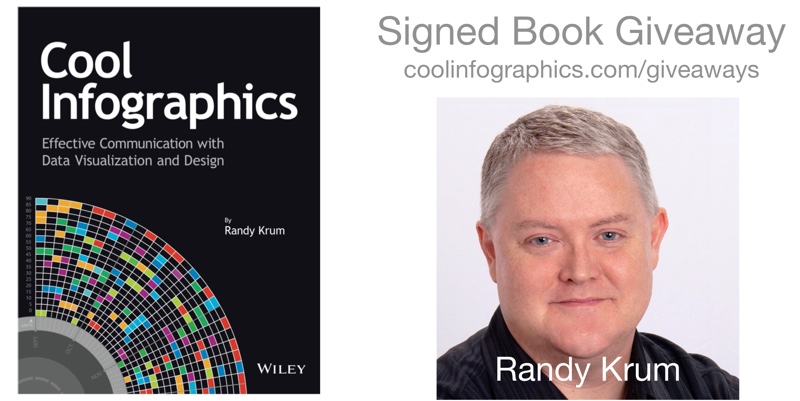
Cool Infographics Book Giveaway December 2017

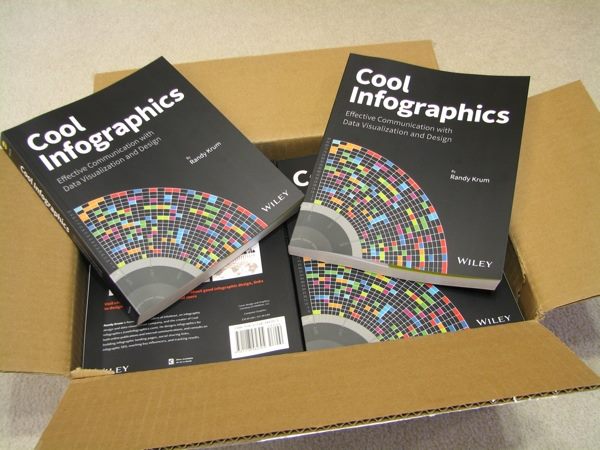
During December 2017, I am giving away one signed copy of my book Cool Infographics

Register on the Giveaways Page by December 15, 2017 to be entered.

I posted this on the Giveaways page in November but forgot to mention it here, so I'm extending the registration deadline until December 15th.

You can always download a free chapter from the Book page to get a sample from the 1st chapter, The Science of Infographics.

A cool infographic tells a story visually —an engaging story built with your data. More than just using pictures or colorful charts, infographics create the type of visual information that your audience will quickly grasp and remember.  Inside, the fundamentals of infographics are clearly explained for both novices and experienced professionals.

PrintView Printer Friendly Version

EmailEmail Article to Friend

Reader Comments

There are no comments for this journal entry. To create a new comment, use the form below.
Editor Permission Required
While we are migrating to a new site design, you must have editing permission for this entry in order to post comments.