About
Randy Krum
President of InfoNewt.
Data Visualization and Infographic Design

Infographic Design

Infographics Design | Presentations
Consulting | Data Visualizations

DFW DataViz Meetup

Join the DFW Data Visualization and Infographics Meetup Group if you're in the Dallas/Fort Worth area!

Search the Cool Infographics site

Custom Search

Subscriptions:


Feedburner

The Cool Infographics® Gallery:

How to add the
Cool Infographics button to your:

Cool Infographics iOS icon

- iPhone
- iPad
- iPod Touch


Read on Flipboard for iPad and iPhone

Featured in the Tech & Science category

Flipboard icon

Twitter Feed
From the Bookstore

Caffeine Poster

The Caffeine Poster infographic

Entries in ad (56)

Thursday
Feb072008

Social Media Building

Another infographic advertisement from Elliance.com to share around your office. How do the different Web2.0 services available today address the different needs within a company? An ideal graphic to share with the people in your organization that don't really understand how they can use these new web services.

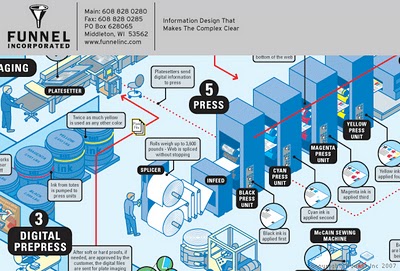
Elliance is posting a weekly series of infographics on their site to help explain their services.

Tuesday
Feb052008

Search Engine Optimization

Elliance.com is posting a weekly series of infographics to help explain and advertise their SEO services. These graphics talk directly to corporate individuals that want better websites, but don't design websites themselves.

A great way to use infographics to talk to your target customers, and I think it shows how well Elliance knows their target audience.

Thanks Christy!

Wednesday
Jan302008

Superior Coffee


Another one from Beau and Alan Daniels at beaudaniels.com that I really liked. Superior Coffee is half blueprint, half illustration that helps communicate the Superior Coffee strategy of delivering a better coffee to customers and is used at trade shows. A good way to visually show the technical aspects behind a product.

Wednesday
Jan162008

The Price of Gasoline

This image was real popular on Digg.com this week. It's hosted on tinypic.com, but there's no author listed.

I love simple infographics like this that use a visual metaphor to instantly get the point across. You can tell someone that the price of gas is comparable with Coke, but putting gas in the Coke signature bottle will get more people to understand the message.

My own reaction was probably the opposite of what the author intended. My first thought is "Coke costs how much?!?" I know there is a lot more expense in producing gasoline than there is in producing Coke. They must really be marking the price up a lot for brown sugar-water.

There is a similar analogy in the U.S. regarding bottled water. Some bottled water brands are now more expensive than gasoline! How is that possible?!?

Friday
Dec212007

FREE Infographic Holiday Cards!


This is one of the example infographics from Funnel, Inc. I got a postcard from them offering infographic holiday cards, FREE while supplies last. You won't find the link on their website, but the direct URL is http://www.funnelinc.com/holiday. Order yours quick!

By the way, the example infographic above is "How Books are Made" and shows the entire process to print books at Webcrafters, Inc. in Madison, WI.

Monday
Nov052007

Infographic Video Advertisement


Found on Uswim, a French company developed an ad campaign around the infographic video style we saw in the Royksopp video.

It had such an impact that a few years later Areva, the French nuclear giant, wanted to use it for their advertising. Being denied it by the Norwegian pop group they finally went for the hit “Funky Town” on a video that looks very similar (as it was done by the same French art collectif H5 that did Royksopp’s video).


Their objective was to show Areva’s expertise in the energy sector (see their corresponding website using Flash animation) as part of the branding campaign of a company anticipating to go private (still waiting because of internal French politics). The choice of animated graphics was to reinforce the educative aspect on Areva’s business and avoid the harsh reality of images of nuclear plants. In a way the almost childish graphics (almost like a comic strip) make it look like a video game of some sort, some kind of SimCity. It was very successful and the idea was again used in a slightly different angle (accelerated special effects video) by EDF (another French energy giant) in a commercial

I found the link to Uswim on Simple Complexity.


Page 1 ... 2 3 4 5 6