


Thursday
Aug142014
Coolness Graphed
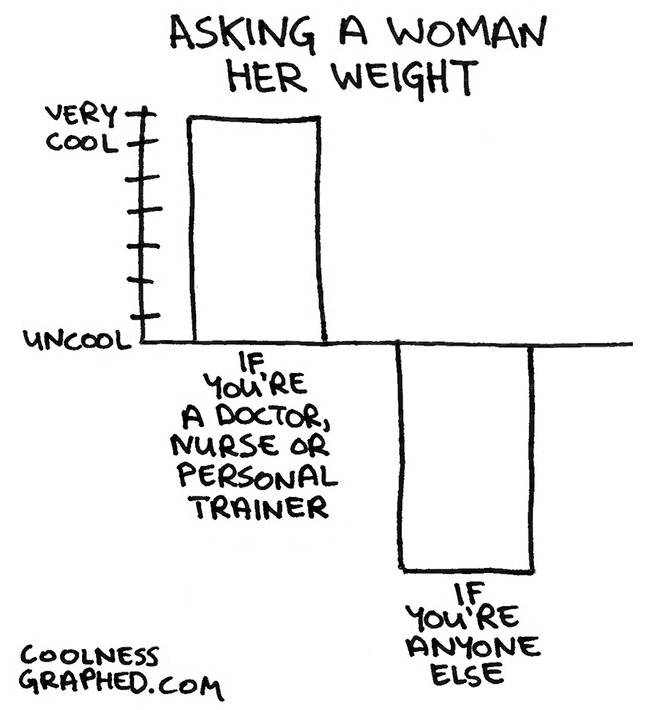
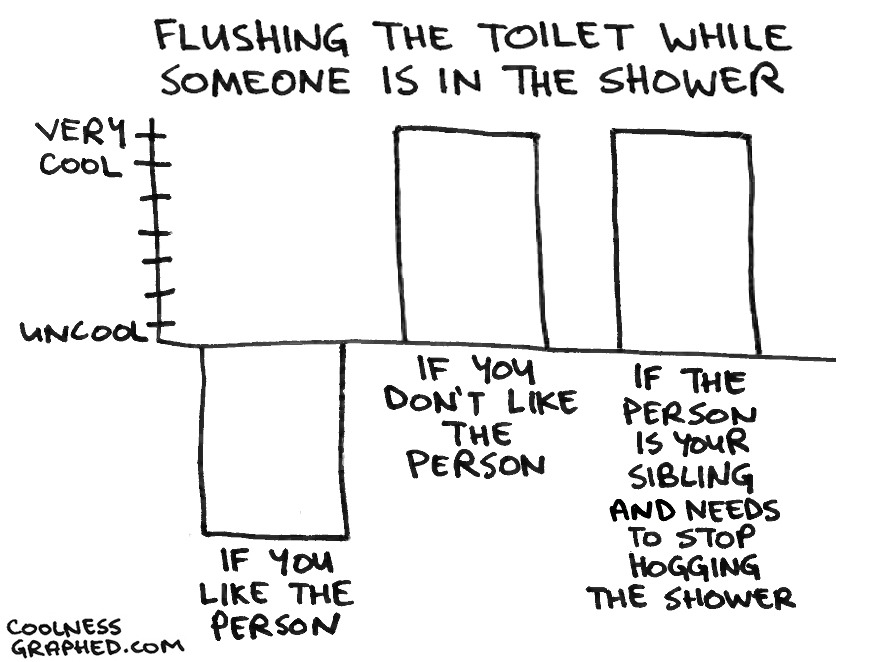
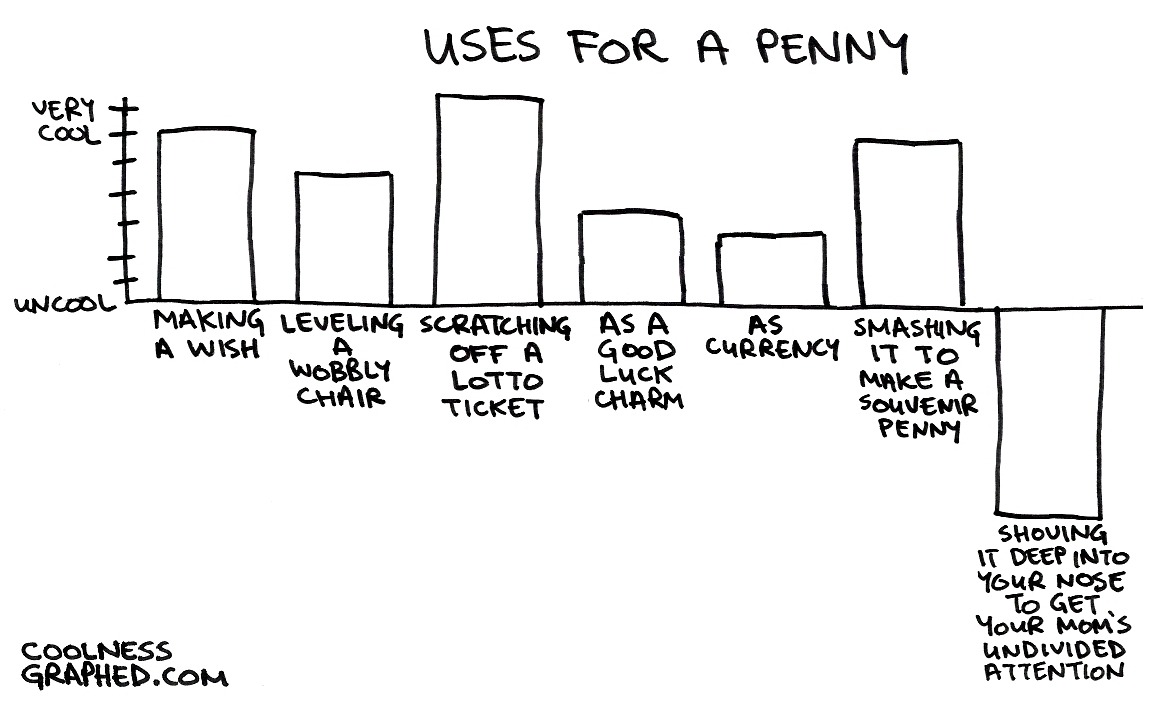
Coolness Graphed.com has a collection of bar graphs that describes when certain actions are deemed “cool” or “uncool”. The three shown here are just a few examples from the website.
Coolness Graphed.com brings normal events together with a humorous flare by rating them in a “cool”/”uncool” bar graph. The bar graph works well with the events as a visual ranking system. No real values are needed. Data visualization used brilliantly! It only takes seconds for the audience to understand each one, and they are highly sharable in social media.
The site has been running for more than two years now, and keeps getting funnier! Thanks to Jones for sending in the link!
Now also available in a book!
tagged  Visualization, bar graph, book, chart, cool
