Commercials, we don’t like them but we still have to watch them. (Except for superbowl commercials, those are funny!) However, they are expensive to make and a lot of thought goes into them. The Anatomy of a Television Commercial by Voices.com explains what it takes to be a commercial worth it’s costs to make.
Learn about how to create a compelling TV ad in this visually appealing infographic. See key developments in the television ad industry and who the key players are. Learn how to write a script, what a good script length is and how to choose the right voice talent for a TV commercial.
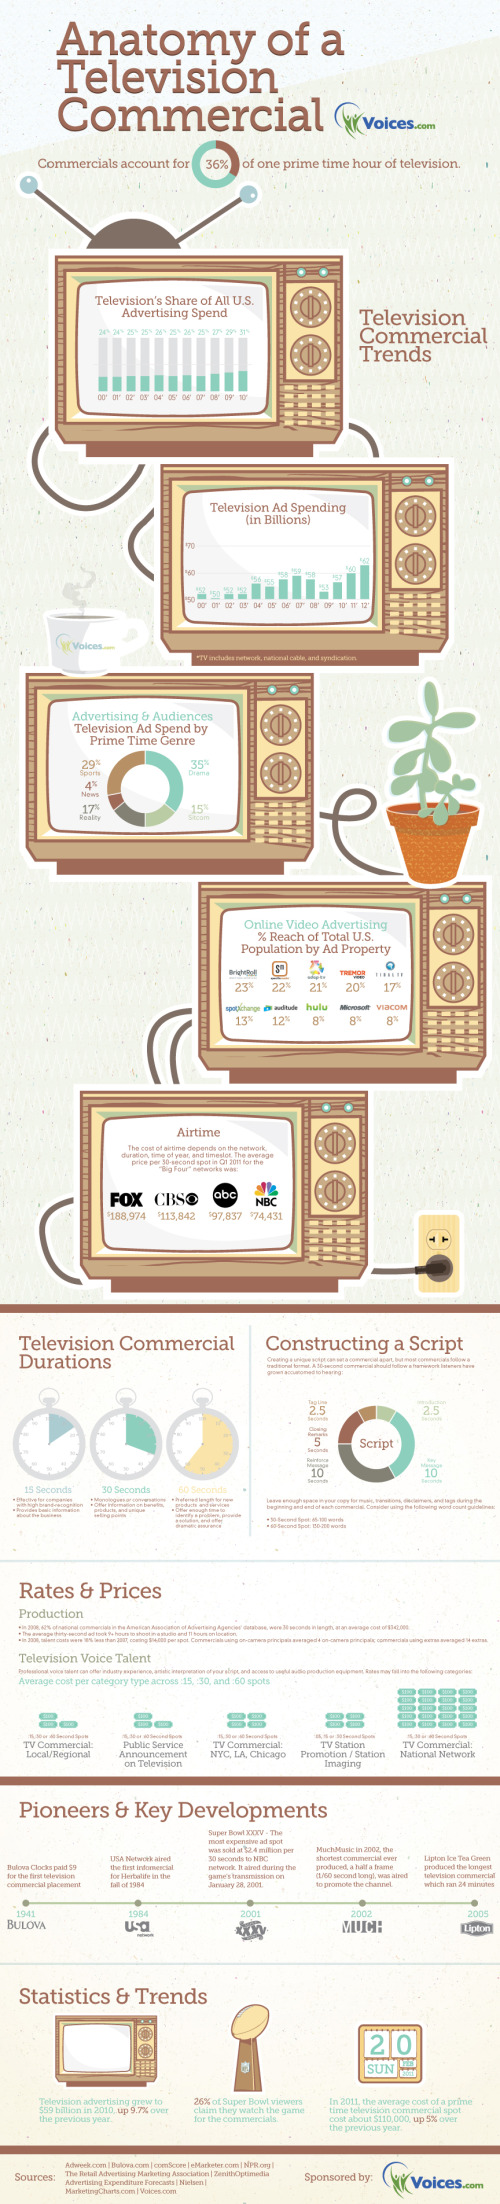
This design does a good job leading the reader through a story top-to-bottom. The use of the TV illustrations as frames for the different data visualizations consistently reinforces the television-related topic without text.
Where they messed up the visualizations is in the Television Commercial Durations section. At first, I couldn’t understand why the visuals all looked wrong, but I finally realized they made a full circle equivalent to 100 seconds, instead of the standard 60 seconds used on EVERYONE’S clocks all over the world! The 60-second visual should be a full circle, and not the 2/3 shaded circle shown. Big visualization mistake! Don’t confuse your audience.
I find it interesting that ad spending and television ad portion of advertising budgets continue to rise even with some many new ways to more effectively advertise online. If there are any advertisers reading this post, may I point your attention to the Advertise page for Cool Infographics…
Thanks to Ashley for sending in the link!


 Randy
Randy