About
Randy Krum
President of InfoNewt.
Data Visualization and Infographic Design

Infographic Design

Infographics Design | Presentations
Consulting | Data Visualizations

DFW DataViz Meetup

Join the DFW Data Visualization and Infographics Meetup Group if you're in the Dallas/Fort Worth area!

Search the Cool Infographics site

Custom Search

Subscriptions:


Feedburner

The Cool Infographics® Gallery:

How to add the
Cool Infographics button to your:

Cool Infographics iOS icon

- iPhone
- iPad
- iPod Touch


Read on Flipboard for iPad and iPhone

Featured in the Tech & Science category

Flipboard icon

Twitter Feed
From the Bookstore

Caffeine Poster

The Caffeine Poster infographic

Entries in conference (27)

Wednesday
Jan092013

Strata Conference CA Feb 26-28 - 20% Discount Code

2013 Strata Conference

If you have any thoughts of attending the 2013 Strata Conference in Santa Clara, CA, the discount code “COOL20” will cut 20% off the registration price for readers of Cool Infographics!  Big data, visualization, privacy, science and business!  What’s not to love?!?

This is an expensive conference, so the 20% discount is a BIG deal; saving hundreds of dollars!  The 2013 conference will run from February 26-28, 2013 in Santa Clara, CA.  If you can register early…

Early REGISTRATION Prices END THURSDAY, January 17TH!

Strata Conference 2013 - Feb 26-28, 2013 in Santa Clara, CA

Join the best minds in data for the latest in the data revolution: trends, tools, new practices, careers, and culture. Bringing together decision-makers, practitioners, and leading vendors from enterprise and the web, Strata provides three days of training, breakout sessions, and plenary discussions, along with an expo hall showcasing the new data ecosystem.

 Check out the video including clips from some of the prior presentations!


Wednesday
Jul112012

Strata Conference NY Oct 23-25 - 20% Discount Code

If you have any thoughts of attending the 2012 Strata Conference + Hadoop World, the discount code “COOL20” will cut 20% off the registration price for readers of Cool Infographics!  Big data, visualization, privacy, science and business!  What’s not to love?!?

This is an expensive conference, so the 20% discount is a BIG deal; saving hundreds of dollars!  The 2012 conference will run from October 23-25, 2012 in New York, NY.  If you can register early…

Best Price Registration ENDS Thursday, July 19th!  [EDITED]

 Now in its second year in New York, the O’Reilly Strata Conference explores the changes brought to technology and business by big data, data science, and pervasive computing. This year, Strata has joined forces with Hadoop World to create the largest gathering of the Apache Hadoop community in the world.

Strata brings together decision makers using the raw power of big data to drive business strategy, and practitioners who collect, analyze, and manipulate that data—particularly in the worlds of finance, media, and government.

Get the nuts-and-bolts foundation for building a data-driven business—the latest on the skills, tools, and technologies you need to make data work—along with the forward-looking insights and ahead-of-the-curve thinking O’Reilly is known for. The future belongs to those who understand how to collect and use their data successfully.  

And that future happens at Strata.

Check out some of the videos from the earlier Strata Conference in California from February 2012!

Friday
Mar092012

Rock of Ages: The Evolution of SxSW

Rock of Ages: The Evolution of SxSW from Music Festival to Interactive Launch Pad is a new infographic from Rocksauce Studios just in time for SxSW 2012 this weekend.

Since 1987, SXSW has morphed into an interactive, film and music conference and festival that brought together 19,364 attendees in 2011.

Austin-based app development firm, Rocksauce Studios, has created an infographic that dissects the interactive portion of SXSW, and proves why this conference is the new popular techie playground.  

The topics and cited statistics covered in “The Evolution of SXSW from Music Festival to Interactive Launch Pad” include:

- History of SXSW
- 2011 Attendance Demographics
- Top 10 Types of Business of Interactive Registrants  
- Geographic Breakdown of Total Interactive Registrants
- Successful SXSW Startup Launches
- Recent SXSW Web Awards  / Interactive Awards Winners
- Reasons So Many Companies Chose to Launch at SXSW
- The Accelerator

You can read more about the development of the infographic on Silicon Angle

This design does a really good job with the visual basics.  Showing the icons/logos of the startup companies, illustrating the business types, mapping the conference registrants. The overall design tells a good story top-to-bottom to the readers, and it’s easy to follow the flow of information.

Three things stood out to me that could be improved:

  • There are a lot of data values in the text of the timeline that should have been visualized.
  • The three shapes showing the amount of Interactive Conference Participants, Conference Sessions and Interactive Media in Attendance all of different values, but the shapes are not sized to match those values.
  • The last section “The Accelerator” seems to fall apart as all text, even though there are some good data values there that should have been visualized.

Thanks to Kelly for sending in the link!

Monday
Feb062012

Infographic Events Calendar 2011-2012

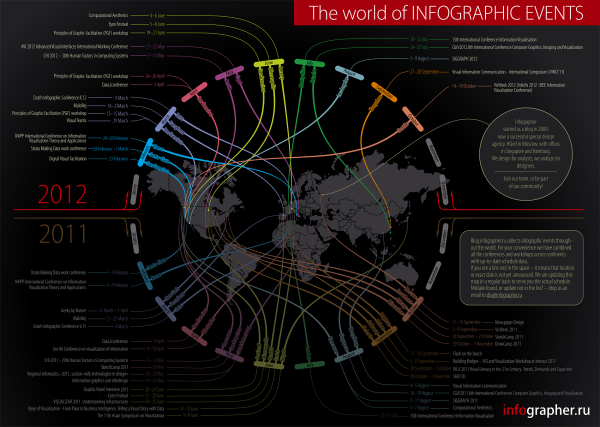
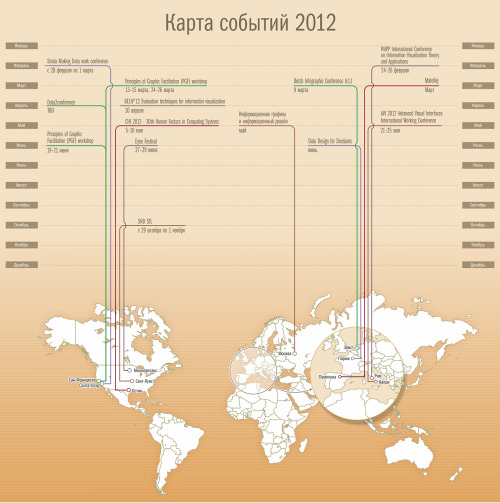
Outstanding calendar-map infographic from Infographer.ru, a Russian infographics site and design agency in Moscow (view in English).  The Infographic Events Calendar 2011-2012 shows many (but not all) visualization, data and infographic conferences and events around the globe.

For everyone who is interested in information design we prepared the events calendar. We found over 44 conferences and workshops, dedicated to infographics and visualization topic all over the world.

The idea to make this kind of ‘map-calendar’ of events appeared in our mind a long time ago, we started to collect data in 2011 and suddenly 2012 started. So we decided to combine both years and show the history for 2011 and actual events for 2012, which you can use for your personal planning.

They collected over 40 conferences and workshops dedicated to information visualization for last year and the upcoming schedule for 2012.  The calendar-map color codes the events by month and obviously connects them to the correct location on the world map.

If you know any corrections or additions to the event included, please post them in the comments!  I know they will be reading them, and would welcome all feedback.  Here are a few events I think they should add to their list:

  • South by Southwest Interactive, Austin, TX, March 9-13, 2012
  • TDWI World Conference (Tableau), Las Vegas, NV, February 13-15, 2012
  • Big Data 2012, Paris, France,  March 20-21, 2012

I like the text of the city name included in the connecting lines, and the months with no events are gray so they don’t add to the visual noise of the bright colors.  Somewhere on the design they should have included the URL for people to find their original posting.  When this get shared online, readers will have a hard time finding the original site.

Infographer also posted some behind-the-scenes information about the development of the design.  Check out their early drafts in the complete blog post.

Thanks to Irina for sending in the link and posting the English translation of the development process!

Thursday
Dec152011

Strata Conference - 20% Discount Code

If you have any thoughts of attending the 2012 Strata Conference, the discount code “COOL20” will cut 20% off the registration price for readers of Cool Infographics!  Big data, visualization, privacy, science and business!  What’s not to love?!?

This is an expensive conference, so the 20% discount is a big deal!  The 2012 conference will run from February 28 - March 1 in Santa Clara, California.

Strata Conference is the leading event for the people and technology driving the data revolution. The home of data science, Strata brings together practitioners, researchers, IT leaders and entrepreneurs to discuss big data, Hadoop, analytics, visualization and data markets.

Check out some of the videos on the Strata site to see the presentations from 2011!

Thursday
Mar032011

The Infographic History of SxSW

To help commemorate the 25th birthday of the South by Southwest (SxSW) conference this year, Eloqua teamed up with JESS3 to create this huge circular timeline.  Memorable moments and events are described around the outside, while the attendance of the three main conference topics (music, film, interactive) are visualized in the middle.  It was so large, i had to drop it into Zoom.it to make it interactive.  You can download the high-resolution PDF file here.

we collaborated with design partner JESS3 to produce an infographic, titled “The History of SXSW,” which celebrates the festival’s impact on the cultures of music, film and technology.  We also dug up (and visualized) a massive number of did-you-know facts about the epic festival.

SxSW started in 1986 with only 700 people attending, but has exploded in the last few years to draw in over 36,000 people to Austin, TX.  This year, SxSW will be held March 11-20.

Thanks to Abby for sending it in, and it was also a very popular post on Mashable.

Thursday
Jun182009

Videos online from the See Conference #4


A couple months ago (April 18th), the See Conference #4 was held in Wiesbaden, Germany.  This one-day event had a great lineup of speakers:  Aaron Koblin (Google Creative Lab), Julian Oliver (software artist), Gijs Joosen (ONL), Eric Rodenbeck (Stamen Design) and Prof. Dr. Gerhard Roth (University of Bremen).  The event was organized by Scholz & Volkmer (www.s-v.de).

The best part is that videos of the entire day of speakers are now available online from the event website at www.see-conference.com.  Some of the videos are in German, but Eric Rodenbeck, Julian Oliver, Gijs Joosen and Aaron Koblin are speaking English for their presentations.

Thanks Chantal!

Page 1 2 3