


Diabetes: The Silent Scourge
 Randy
Randy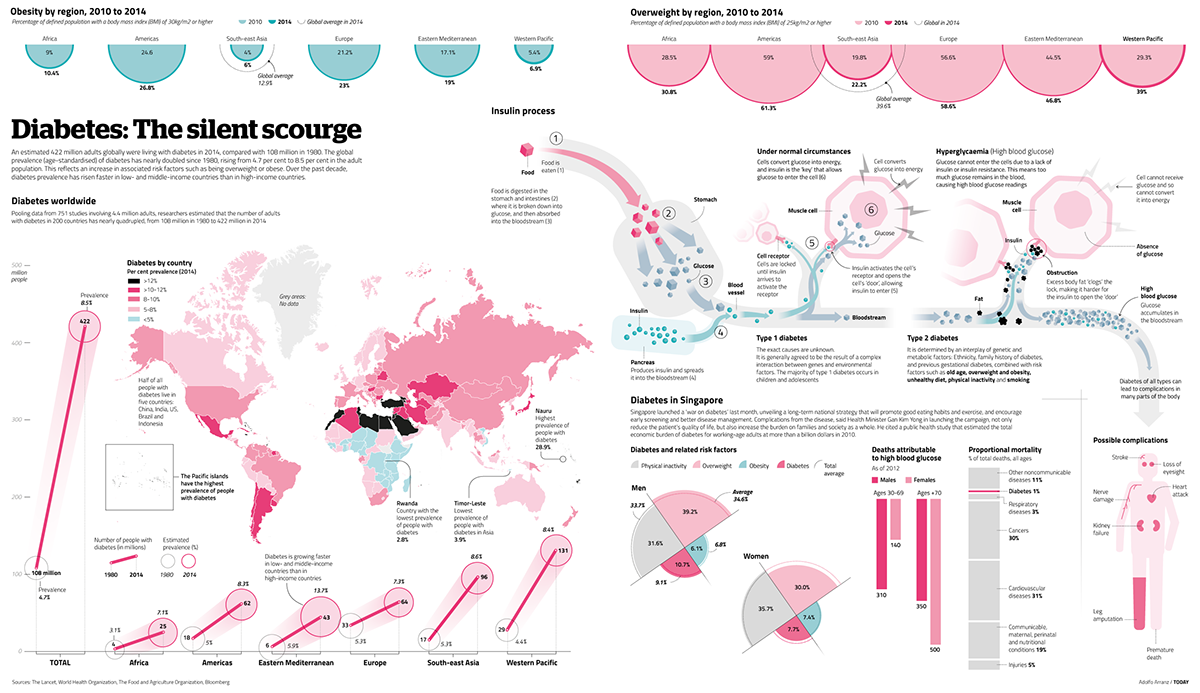
Diabetes: The Silent Scourge is a great 2-page spread infographic designed by Adolfo Arranz for the Today newspaper in Singapore. A worldwide growing health issue!
An estimated 422 million adults globally were living with diabetes in 2014, compared with 108 million in 1980. The global prevalence (age-standardised) of diabetes has nearly doubled since 1980, rising from 4.7 per cent to 8.5 per cent in the adult population. This reflects an increase in associated risk factors such as being overweight or obese. Over the past decade, diabetes prevalence has risen faster in low- and middle-income countries than in high-income countries. Infographic spread page for Today newspaper.
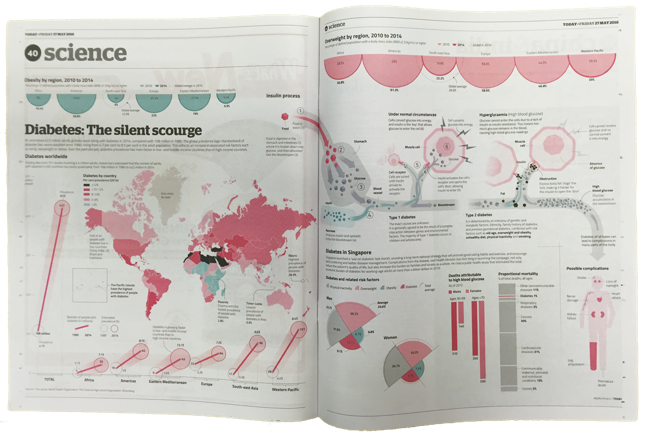
Notice the creative use of half-circles proportionally sized to match the "By Region" data. This accurately represents the data, but only take half the space on the page!
The use of many different visualization methods also helps the readers understand that there are many different data sets being shown. Slopegraphs, rose diagrams, colored map, bar charts, stacked bar charts and the half-circles all shown different facts about the diabetes epidemic.
Great work Adolfo!
