About
Randy Krum
President of InfoNewt.
Data Visualization and Infographic Design

Infographic Design

Infographics Design | Presentations
Consulting | Data Visualizations

DFW DataViz Meetup

Join the DFW Data Visualization and Infographics Meetup Group if you're in the Dallas/Fort Worth area!

Search the Cool Infographics site

Custom Search

Subscriptions:


Feedburner

The Cool Infographics® Gallery:

How to add the
Cool Infographics button to your:

Cool Infographics iOS icon

- iPhone
- iPad
- iPod Touch


Read on Flipboard for iPad and iPhone

Featured in the Tech & Science category

Flipboard icon

Twitter Feed
From the Bookstore

Caffeine Poster

The Caffeine Poster infographic

Entries in Disney (8)

Wednesday
Jul192017

Disney Live Action Movies: Best (And Worst)

Disney Live Action Movies: Best (And Worst) infographic

The Disney Dollars infographic from FUN.com compares the total box office revenue for all of Disney's live action movie franchises.

Disney live action films have a long history of wonderful stories, memorable characters, and some big (and by big we mean humongous) box office wins. While the company started in 1923 in animation, quite successfully, they didn’t start making 100% live-action films until the 1950s. Just like the animated films, it didn’t take them long to create a classic (or two or three or four). Remember the frightening steam-punk fantasy of 20,000 Leagues Under the Sea, or the whimsical world of Mary Poppins, or the three-dimensional wizardry of Tron? Even those classics can’t compare to the sheer box office juggernauts of the past two decades. Disney owned the blockbuster with Pirates of the Caribbean, the remakes like Alice in Wonderland and Cinderella, and who could let the holidays go by without a viewing of The Santa Clause…. Of course, with so many films being made, there have been some box office clunkers, as well. Poor Tomorrowland…

This infographic tracks all the live action films that made the top Disney dollar, and lost plenty of Disney dollars, as well.

I understand the overall bar chart design, with bars for the total of each franchise. However, the breakdown of the movies included in each franchise doesn't the distribution of each movies contribution correctly. those are just equal rectangles that span the width of the infographic.  The individual movies should visually show their contribution proportional to the total!

I don't like the scale cheat for the Pirates of the Caribbean franchise. Visually it misleads readers since the franchise has earned almost four times the revenue as the Narnia series.

Also, the length of the Narnia bar is just plain WRONG! Based on the data and the descending order it's supposed to be longer than the Alice in Wonderland bar.

Friday
Feb212014

Which Disney Park is the Happiest?

Which Disney Park is the Happiest? infographic

There is definitely some competition between the various Disney parks, and the Which Disney Park is the Happiest? infographic design from Cheap Flights tackles this competition head-on!

There are a handful of things that this design does right:

  • The design is about Disney, but isn’t endorsed or from Disney so they correctly avoided using any official logos that might cause a trademark infringement.
  • Most of the data is visualized, and not just shown in text!  There are a few stats near the end that are just shown as text with an icon, and readers will consider these as secondary, less-important statistics.
  • The consistent icons for the different parks, helps the readers compare between the separate data visualizations
  • Proportionally sized circles are shown a few times, correctly sized by area.
  • Data sources and the publishing company are clearly shown in the footer.
  • The infographic clearly walks the reader through the relevant information, and makes a case for a specific, controversial conclusion, which invites comments and engagement from the readers.

There are a couple things I would suggest as improvements:

  • The double bar used for WDW Florida in the Number of Hotels bar chart mis-represents the data.  I’m sure they did it to keep the overall length of the design shorter, but to give the audience an accurate understanding of how many more hotels there are in Florida, this should be shown as a single bar at the full, correct height.
  • The footer should include the URL to the original infographic on the Cheap Flights site.  It’s actually hard to find the original because there are no links to the infographic anywhere else on the site.

Personally, I favor the Florida parks, and can’t wait to get back there soon!

Found on the Huffington Post

Friday
Sep282012

The History of Mickey Mouse

The History of Mickey Mouse infographic

Mickey Mouse hasn’t just survived for 80 years, he has thrived. The History of Mickey Mouse infographic from Goin2Travel.com has condensed this famous mouse life style into a highlight timeline.

Mickey Mouse is the most recognizable Disney character on the planet. After more than 80 years of stardom, we thought it would be fun to review the history of this iconic mouse. From humble beginnings during the “roaring twenties”, surviving and even flourishing during the “great depression” right up to the digital age present, he and his fellow, Disney stars, are favorites of children everywhere.

So whether your planning a visit to Disney World Orlando, or just a fan,  sit back, relax, and enjoy this visual history trip through time of Mickey Mouse.

They did a good job of showing the reader actual images and photos of Mickey through the years, and I like the use of Mickey Hands as the arrowheads on the connecting lines.  

The biggest issue is that many of the images are so far away from the correct year along the righthand side, that it’s very hard to follow the connecting lines.  You really don’t want images from the 1950s visually placed next to 1970s on the timeline.  I would suggest putting the years down the middle and placing the event images on both sides so they can be adjacent to the actual time on the timeline.

The URL at the bottom should be a link to the original infographic instead of the frontpage of the company site.  You want readers to be able to find the original infographic when it’s not correctly linked on the Web.

Tuesday
Jun152010

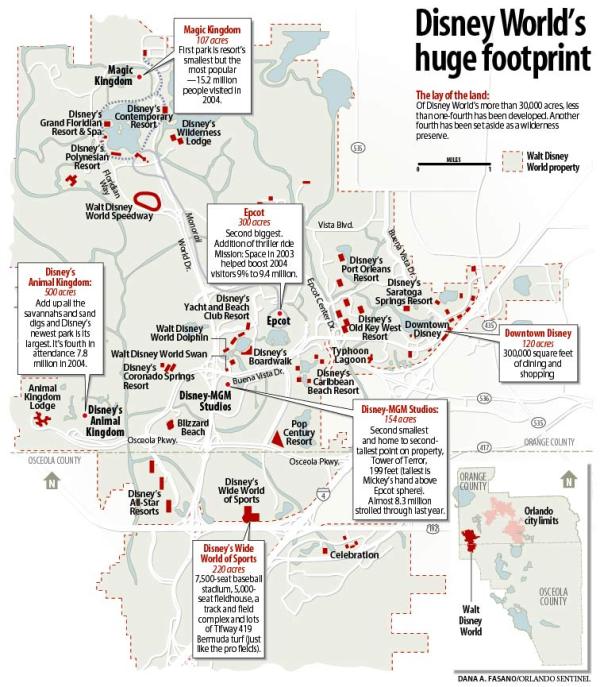
Walt DisneyWorld's Huge Footprint

From Dana Fasano at the Orlando Sentinel comes Walt DisneyWorld’s Huge Footprint.  This area map showing how little of the land that Disney owns near Orlando has actually been developed.

Of Disney World’s more than 30,000 acres, less than one-fourth has been developed.  Another fourth has been set aside as a wilderness preserve.

Found on Six Revisions

Wednesday
Jun242009

Disney: Inside the Matterhorn Infographic


From the OC Register, an infographic with an inside look at the Matterhorn at Disneyland in Anaheim, CA.  Celebrating its 50th anniversary, this is a rare inside look behind the scenes of a Disney ride.

Friday
Aug082008

The Ropes at Disney


Found on CartoonBrew, this circular chart from 1943 shows the development process of an animated film through the different roles within the Disney organization.  Not exactly an org chart, this is more of a process map.

How do they make those drawings move?  This chart, an separate pull-out from the 1943 booklet, The Ropes At Disney’s (see below), explains the whole process.You’ll note that it all starts with “Walt”. And his main focus was “Story” and “Direction”.

Can you tell I’m going to Walt Disney World today?


Saturday
Dec222007

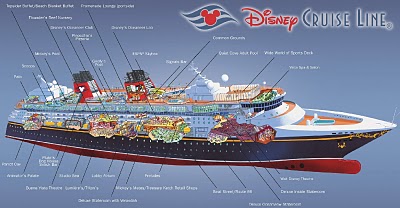
The Disney Cruise Line Cut-Away


The family took our first Disney Cruise this year, which was fantastic! Here’s a great cut-away graphic of the Disney Wonder, but the other ship, the Disney Magic is almost identical. This graphic is a little out of date, because some things have changed. The ESPN Skybox is now a teen area called The Stack or Aloft depending on which ship you’re on.

The ship is actually quite large, so the spacial representation of locations is really helpful. You can get turned around very easily.

Sunday
Aug262007

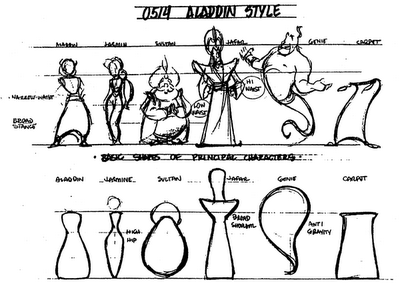
Drawing Disney Characters


Silver Bullet Comics has an article for aspiring comic artists, but I found this little gem.

A very simple infographic demonstrating that characters much each have a distinctive shape that makes them recognizable even from a distance. Very similar to the “silhouette test” for good character drawings to be recognizable in silhouette.