About
Randy Krum
President of InfoNewt.
Data Visualization and Infographic Design

Infographic Design

Infographics Design | Presentations
Consulting | Data Visualizations

DFW DataViz Meetup

Join the DFW Data Visualization and Infographics Meetup Group if you're in the Dallas/Fort Worth area!

Search the Cool Infographics site

Custom Search

Subscriptions:


Feedburner

The Cool Infographics® Gallery:

How to add the
Cool Infographics button to your:

Cool Infographics iOS icon

- iPhone
- iPad
- iPod Touch


Read on Flipboard for iPad and iPhone

Featured in the Tech & Science category

Flipboard icon

Twitter Feed
From the Bookstore

Caffeine Poster

The Caffeine Poster infographic

Entries in election (24)

Monday
Sep142009

Obama's Worldwide Stamps of Approval infographic


From our friends at GOOD transparency, is a simple infographic showing President Obama's worldwide approval rating.  I like the use of stamps to help identify the countries around the world, and that the order is representative of highest approval to lowest approval ratings.  I think this graphic lacks the use of illustration to convey the data.  The actual approval ratings are only communicated with the numbers without any graphic representation.
During the campaign, President Obama argued that his election would help restore the image the rest of the world has of United States.  In the six months since his election, his approval ratings at home have slipped, though they remain high. Around the rest of the world, opinion is mixed. A recent study by WorldPublicOpinion.org asked people in 21 countries whether they had confidence that Obama would “do the right thing” when it came to world affairs. Our latest Transparency is a look at their responses.
One other criticism would be that the text implies that we should be looking at how worldwide opinion has changed since Obama's election, but the data is actually only a snapshot of opinions six months after the election.  No indication is this is higher or lower than the opinions at the time of his election.

A collaboration between GOOD and Michael Newhouse at Newhouse Design.

Thanks Michelle for the link!

Wednesday
Jan212009

A New President - Wordle

Wordle: A New President

I don't think I've ever posted about Wordle.net. So I thought this word cloud of President Barack Obama's inaugural address yesterday would be a good example.

Wordle is a toy for generating “word clouds” from text that you provide. The clouds give greater prominence to words that appear more frequently in the source text. You can tweak your clouds with different fonts, layouts, and color schemes.

Tuesday
Nov042008

Create Your Own Electoral Map


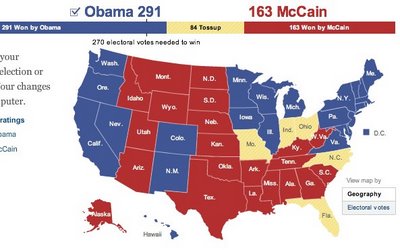
Since today is Election Day, the nytimes.com has a neat feature that lets you create your own Electoral Map.  Ireally like that it also gives you the option (seen above) to view the country with teh states sized by electoral votes or by geography (below).


It's been preloaded with the NYTimes.com breakdown of how the states may fall today, and which states are still undecided.  It's a little misleading because there are more undecided states, but they have assumed they will lean as the have historically.  It also allows you to change them on your own so you can see the effect on the overall election.

When your done playing, you can also see the NYTimes version of the map that includes the states that are leaning, but are not yet truly decided.


As you can see, the NYTimes.com site is predicting a Democratic win.  Let's see what really happens today.

Tuesday
Oct282008

Map of Newspaper Presidential Endorsements


Staying on the presidential election theme, here's a great infographic on infochimps.org.  Red shows newspapers endorsing McCain, and Blue show newspapers endorsing Obama.  The inner color of each circle also represents which candidate the newspaper endorsed in the 2004 election.  The size of the circle represents each newspapers circulation.

Also notice the mismatch between the newspaper endorsement and each state's "Red vs. Blue" alignment.

Thanks Garrett for the link!

Sunday
Oct262008

Does Your Vote Matter?  YES!


Sticking with the stuff from GOOD magazine, this is one of the GOOD Sheets available for sale as a poster at Starbucks for a limited time.  I've been looking for some good election related graphics.  There are a ton out there, but I'm looking for the gems.

I hear all the time that people don't think their vote matters, and in some cases it may get lost in an election that isn't close or competitive.  However, you never actually know if a race is going to be close or not (unless there is only one candidate).

In some of our local elections, I've seen some decisions put up to vote that won by only 12 votes!

I'm not pushing any specific politcal opinion, just that everyone should get out and vote.  Early voting is already open in many areas, so do your part and be heard!

Wednesday
Oct222008

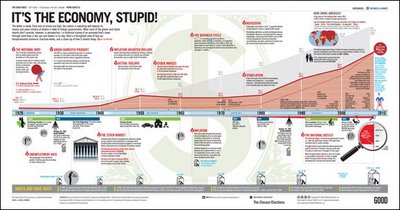
It's the Economy, Stupid!


Great timeline from GOOD Magazine (via picdit.com).
What most of the doom-and-gloom reports on our economy don’t provide is perspective—a historical survey of an economy that’s been through more than a few ups and downs in its day. Here’s a farsighted view of how our temperamental economic machine works, and a close-up of how it stands today.
Thanks Adam!

Monday
Oct202008

NEW Death and Taxes 2009 poster


New Death and Taxes infographic for 2009!  Interactive viewer let's you zoom in to see all of the details.
"Death and Taxes:2009" is a representational poster of the federal discretionary budget; the amount of money that is spent at the discretion of your elected representatives in Congress. Basically, your federal income taxes. The data is from the President's budget request for 2009. It will be debated, amended, and approved by Congress by October 1st to begin the fiscal year.

The poster provides a uniquely revealing look at our national priorities, that fluctuate yearly, according to the wishes of the President, the power of Congress, and the will of the people. If you pay taxes, then you have paid for a small part of everything in the poster. 
The Death and Taxes poster from 2007 was my initial post on Cool Infographics, so I'm very excited to see this update.  Now the 2009 version is available to purchase as a poster here.

Friday
Aug152008

National Debt and the Presidents

First, I'm not pushing any particular political agenda.  There's considerable debate around this chart, so I don't want to start any arguments.  The debate isn't around the validity of the data, but about how it's being presented.  The information is freely available from the U.S. Department of the Treasury and the Bureau of the Public Debt.

Second, I like that this chart takes a simple bar chart and adds a few more layers of information.  At its root, this is a timeline of the increase in the national debt based on the federal budget by year.  Then layered on top of that are the presidents in office that year, some color coding, the political party controlling the White House and highlights for record years.

Third, just to share the reasons for the debate.  This is a great example of data being visualized with a specific agenda in mind.  Obviously, this is a chart framed to make Republicans look bad, and Democrats look good.  The debate centers around a few issues like programs started by one President will carry into the term of another President and more importantly that the political party controlling Congress actually has more impact on the federal budget than the President does.

Monday
Jun232008

Obama Funding Graphic


A small poster from our friends at XPLANE,

How Obama Reinvented Campaign Finance Barack Obama is the first major candidate to decline participation in the public financing system for presidential campaigns. He’s found a more effective way to raise money — by leveraging the power of the American people through online Social Networks.
Available as a PDF formatted for printing on 11x17 paper.

Wednesday
Jun112008

Democratic Party Voting Margins


New interactive infographic by Shan Carter and Amanda Cox on nytimes.com that shows the voter margins between Democratic candidates Hilary Clinton and Barrak Obama. These are based on exit poll data.


Choose any of the sorting criteria on the bottom, and then you can see specific data about any particular state by hovering the mouse over the blocks. The top chart shows how Men voted overall, and the second chart is how voters with No College Education voted.

Thanks Les for sending in the link!