About
Randy Krum
President of InfoNewt.
Data Visualization and Infographic Design

Infographic Design

Infographics Design | Presentations
Consulting | Data Visualizations

DFW DataViz Meetup

Join the DFW Data Visualization and Infographics Meetup Group if you're in the Dallas/Fort Worth area!

Search the Cool Infographics site

Custom Search

Subscriptions:


Feedburner

The Cool Infographics® Gallery:

How to add the
Cool Infographics button to your:

Cool Infographics iOS icon

- iPhone
- iPad
- iPod Touch


Read on Flipboard for iPad and iPhone

Featured in the Tech & Science category

Flipboard icon

Twitter Feed
From the Bookstore

Caffeine Poster

The Caffeine Poster infographic

Entries in tag cloud (5)

Friday
Apr222011

The Tweet Topic Explorer


Jeff Clark at Neoformix has created a cool, interactive tool that visualizes word frequency in a specific Twitter stream called Tweet Topic Explorer.  You can enter anyone’s Twitter ID and it will generate an interactive visual on the fly.  Above is the visualization of my Twitter ID: @rtkrum.  According to Jeff (see note below), this works in most browsers but has trouble with Microsoft Internet Explorer.

Similar to a word cloud, the area of the circles is sized based on the frequency of that word in the Twitter stream.  Words are clustered together and color-coded if they are often found together in the same Tweets.  The actual text of the Tweets is displayed next to the visual, so you can click on any word and it’s highlighted in the text as well.  Clicking on any Twitter names in the text will generate a new visualization for that Twitter user.


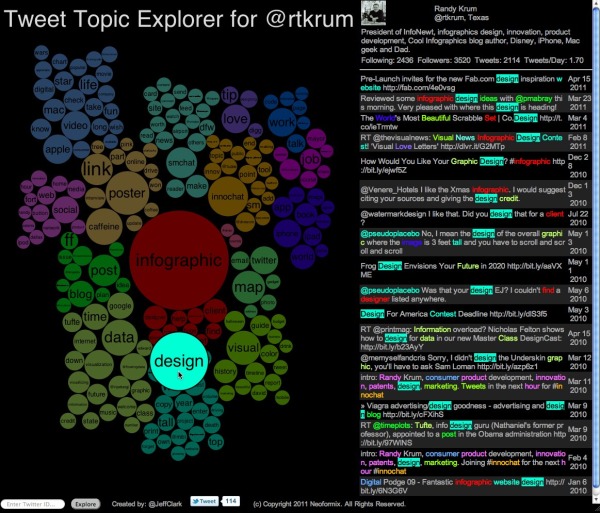
One issue I have is that the font size of each word is adjusted to fit within it’s circle, so longer words are naturally smaller to fit on one line withing the circle.  So even if a long word has a higher frquency (and a larger circle area) it appears smaller to the reader’s eye because the font is so small. 

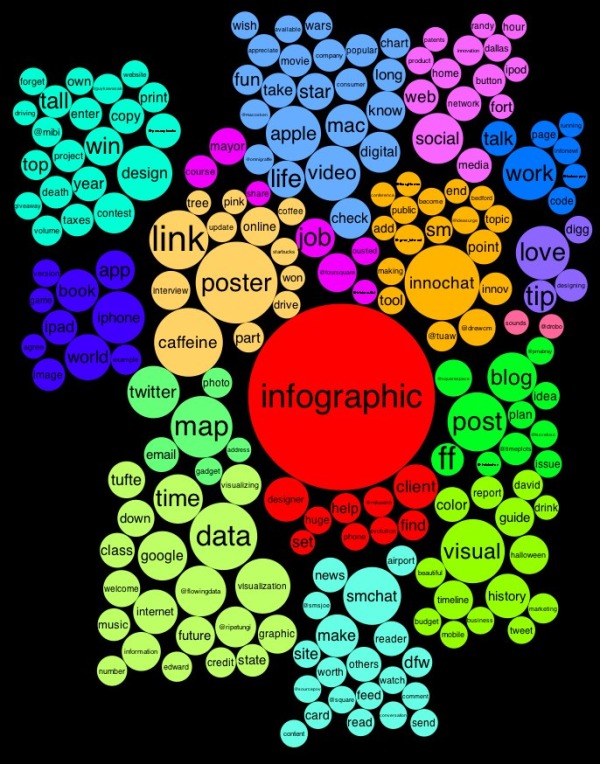
I have created a new tool to help see which topics a person tweets about most often. It also shows the other twitter users that are mentioned most frequently in their tweets. I call it the Tweet Topic Explorer. I’m using the recently described Word Cluster Diagrams to show the most frequently used words in their tweets and how they are grouped together. This example below is for my own account, @JeffClark, and shows one word cluster containing twitter,data,visualization,list,venn, and streamgraph. Another group has word,cloud,shaped,post etc. It’s a bit hard to see in this small image but there is a cluster about Toronto where I live and mentions of run, marathon, soccer. Also, there are bubbles for some of the people on Twitter I mention the most often: @flowingdata, @eagereyes, @blprnt, @moritz_stefaner, @dougpete.

This application was created with the wonderful tool Processing.js which is the javascript-based extension of the Processing tool I have used in the past. Performance is very good with the Chrome browser, and decent in Firefox and Safari. It will not work in Internet Explorer (except perhaps the new IE 9) and currently crashes on iOS devices.

Anyone out there still reading?  Generate a visualization using your Twitter ID and post a link in the comments!

Outstanding job Jeff!  

Found on FlowingData

Tuesday
Jan252011

Horoscoped: Visualizing Our Common Future

Horoscoped is another cool infographic project from Information Is Beautiful.  Scraping the text from over 22,000 horoscopes, a word cloud is created separately for each sign.  This visually shows you how common the words used truly are.

As part of their transparency, the team has also done a fantastic job of providing a description of their entire process and links to all of the data and the scripts here and here.

Taking the most common words from all of the horoscopes, they have created the Grand Unifying Horoscope:

Credits:

CONCEPT & RESEARCH: DAVID MCCANDLESS

DESIGN: MATT HANCOCK

ADDITIONAL RESEARCH: MIRIAM QUICK

HACKING: THOMAS WINNINGHAM

SOURCE: YAHOO SHINE HOROSCOPES


Found on Bad Astronomy and Chart Porn.

Thursday
Sep032009

reMap: An Amazing Visual Browsing Interface to VisualCompexity.com


Bestario has created reMap, an interactive portal to view all of the infographics posted on VisualComplexity.com, and it's amazing.  They've created semantic connection between the different infographics using tags tat allow for an incredible browsing experience.

An interactive, visual browsing interface to an infographic archive.

reMap displays visualcomplexity.com projects allowing navigation using a semantic approach and depicting relations among them. All images and texts belong to vc portal. Tags are assigned using a semantic engine created by Bestiario.
Thanks Jose!  I love it!

Wednesday
Jan212009

A New President - Wordle

Wordle: A New President

I don't think I've ever posted about Wordle.net. So I thought this word cloud of President Barack Obama's inaugural address yesterday would be a good example.

Wordle is a toy for generating “word clouds” from text that you provide. The clouds give greater prominence to words that appear more frequently in the source text. You can tweak your clouds with different fonts, layouts, and color schemes.

Thursday
Oct162008

Brand Tags


BrandTags.net is a project by Noah Brier that gathers user input to create tag clouds for many of the biggest brands in our culture.  You can add your own input into the project on the main page, or browse brand results.  The example above is for Velveeta.