About
Randy Krum
President of InfoNewt.
Data Visualization and Infographic Design

Infographic Design

Infographics Design | Presentations
Consulting | Data Visualizations

DFW DataViz Meetup

Join the DFW Data Visualization and Infographics Meetup Group if you're in the Dallas/Fort Worth area!

Search the Cool Infographics site

Custom Search

Subscriptions:


Feedburner

The Cool Infographics® Gallery:

How to add the
Cool Infographics button to your:

Cool Infographics iOS icon

- iPhone
- iPad
- iPod Touch


Read on Flipboard for iPad and iPhone

Featured in the Tech & Science category

Flipboard icon

Twitter Feed
From the Bookstore

Caffeine Poster

The Caffeine Poster infographic

« InMaps: Viewing Your Business Network | Main | Small Business: By The Numbers »
Tuesday
Jan252011

Horoscoped: Visualizing Our Common Future

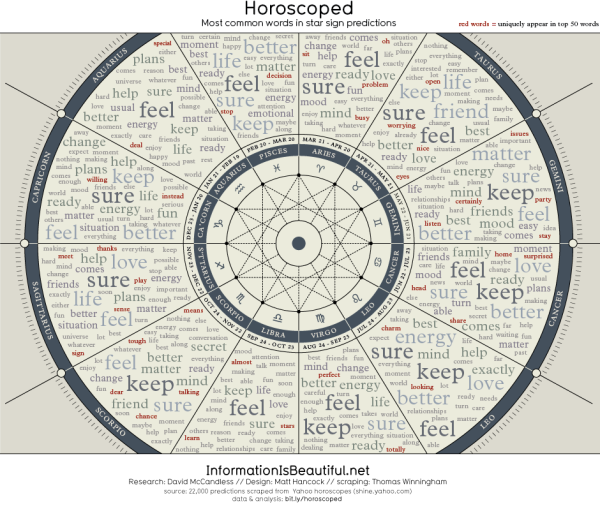
Horoscoped is another cool infographic project from Information Is Beautiful.  Scraping the text from over 22,000 horoscopes, a word cloud is created separately for each sign.  This visually shows you how common the words used truly are.

As part of their transparency, the team has also done a fantastic job of providing a description of their entire process and links to all of the data and the scripts here and here.

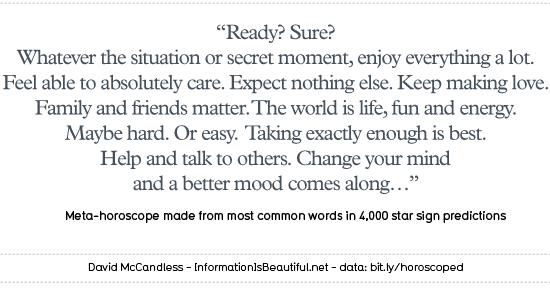
Taking the most common words from all of the horoscopes, they have created the Grand Unifying Horoscope:

Credits:

CONCEPT & RESEARCH: DAVID MCCANDLESS

DESIGN: MATT HANCOCK

ADDITIONAL RESEARCH: MIRIAM QUICK

HACKING: THOMAS WINNINGHAM

SOURCE: YAHOO SHINE HOROSCOPES


Found on Bad Astronomy and Chart Porn.

PrintView Printer Friendly Version

EmailEmail Article to Friend