Fast Fourier Transforms: An Infographic Study Guide
 Randy
Randy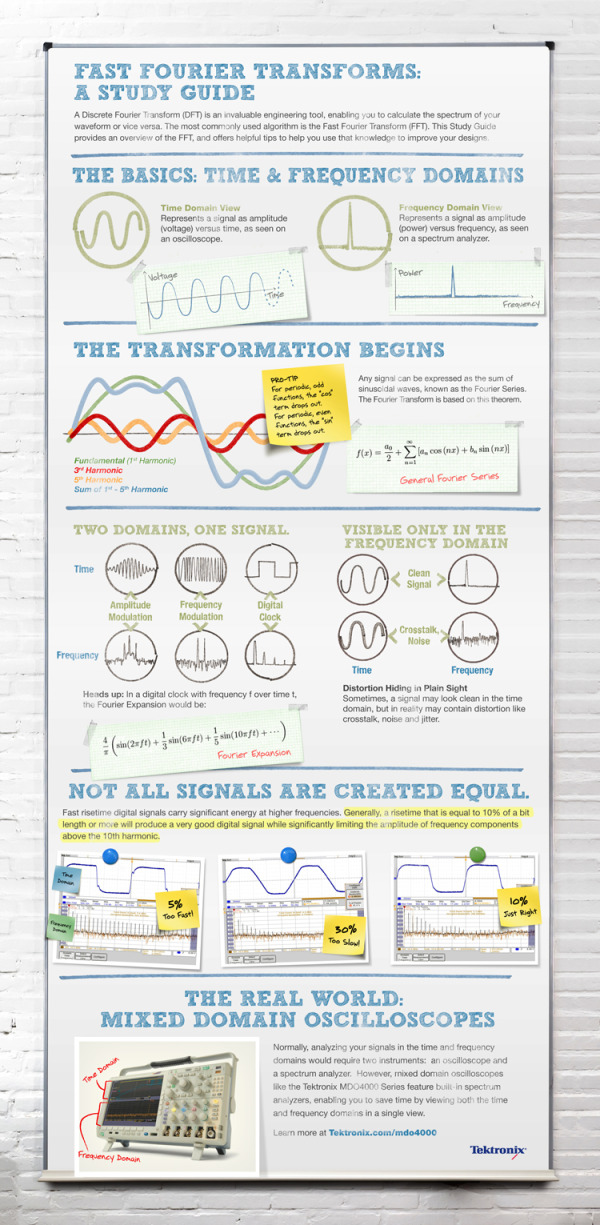
Fast Fourier Transforms: A Study Guide from Tektronix is a great example of using data visualization and infographic design principles to visually explain the math behind their oscilloscopes.
Most engineers don’t remember the complex algorithms and concepts of the Fast Fourier Transform (FFT) and Discrete Fourier Transform (DFT) that they learned in college. Instead of dusting off your textbooks, check out this Fast Fourier Transform visual from Tektronix. It boils down the key tips and practical knowledge for Engineers and their designs. With this visual, we hope you can skip digging up your old text books and get back to your designs.
The design does a good job of telling a story top-to-bottom. Starting with the basics, moving into the more complicated math and finally applying the math to how the oscilloscope product works.
Definitely a design focused on their target audience, and not the general public. However, using infographic design to simplify your message to customers is one of the most effective ways to clearly communicate your marketing message. It’s more memorable to your audience when they come to a purchase decision, and communicating clearly builds your brand credibility with the subject.
At the bottom of the design, they should have included some type of license (copyright or Creative Commons) and the URL to the original infographic landing page. Nothing wrong with listing the URL to the product page, but help readers interested in the information from the infographic find the original full-size version easily.
Thanks to Matt for sending in the link!