Bring Reading Rainbow Back for Every Child, Everywhere.
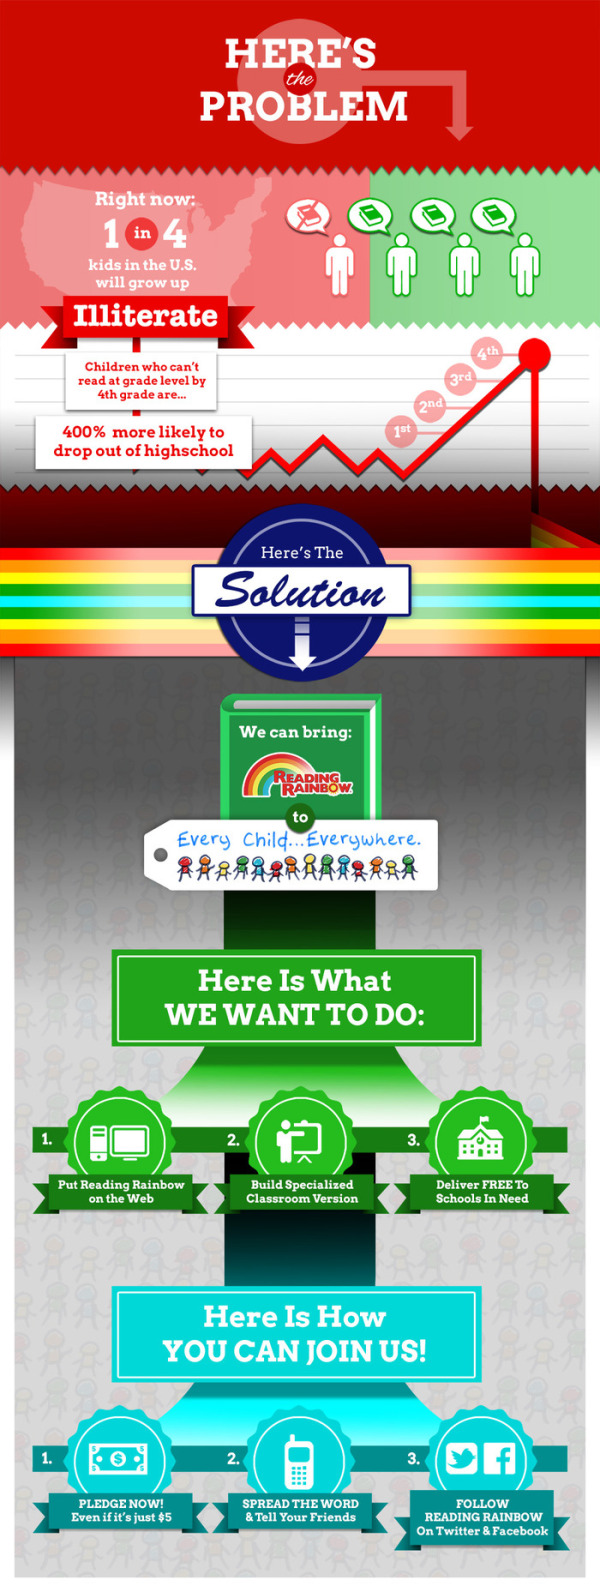
LeVar Burton has a fantastic Kickstarter project running to bring back Reading Rainbow to make it available on multiple internet connected platforms and free to classrooms in need. The team is using multiple infographics to help explain the project and the support the funding campaign goal of raising $5,000,000.
Hi. LeVar Burton here. You may know me as Kunta Kinte, from ROOTS, or Geordi La Forge, from Star Trek: The Next Generation.
You also may have grown up with me on Reading Rainbow.
It was my mother who taught me that, by picking up a book, I could “go anywhere” and “be anything.” Ever since Reading Rainbow began in 1983, I have dedicated myself to fostering a love of reading in children, just as my mother did for me.
Over the past year, I have watched Kickstarter bring communities together to support artists and inventors. Again and again, I have been inspired by watching like-minded people team up to accomplish impossible dreams, and to change the world.
Now, I am hoping you will join me on my mission: to bring Reading Rainbow back for every child, everywhere.
The infographic design above could be improved with the knowledge that people may share the infographic image without the rest of the text and information from the kickstarter page. It should be able to stand alone as an independent asset with a title, and the URL for readers to find their way back to the original infographic on the Kickstarter campaign landing page.
The visualizations help make a huge amount of information about the project easily accessible and understandable to the audience. Take for example this simple illustration of the platforms they would like to reach. Visualizing the multiple devices and operating systems makes the goal super easy to understand.

I think this is an incredibly worthy project, and I hope you join me in contributing:
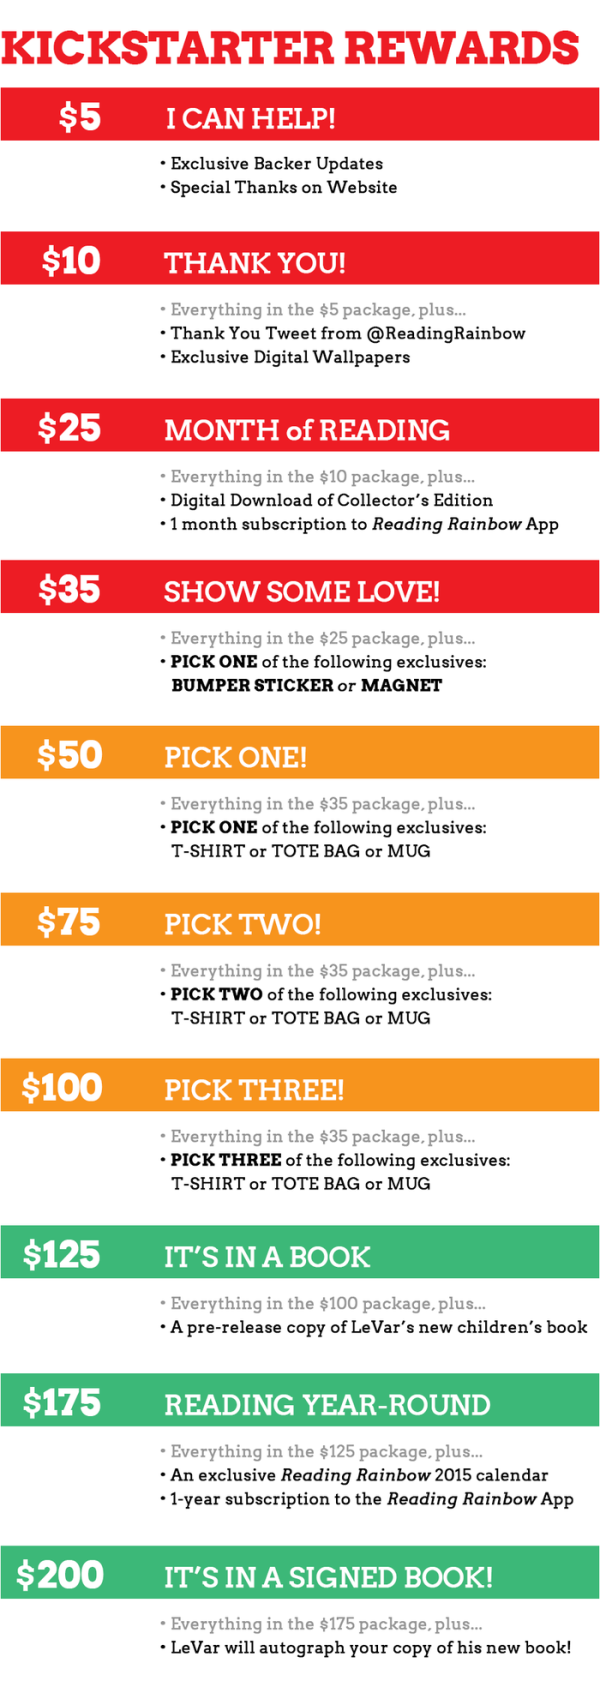
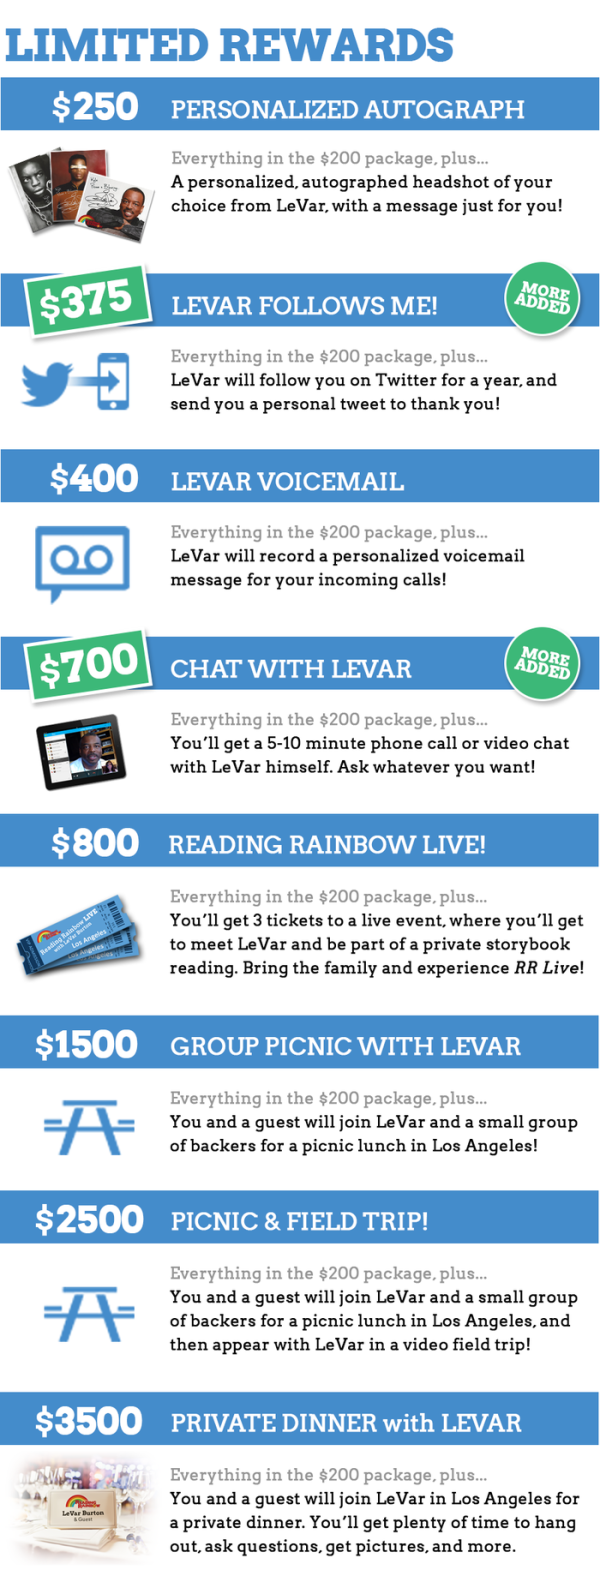
The way Kickstarter works, contributors at different gift amount levels can earn different types of swag merchandise and benefits. This project is particularly complicated with 24 different funding levels with different swag. Although mostly text, the visual lists of funding levels help potential contributors choose their amounts. However, visualizing the swag and benefits with illustrations, icons or photos would have been more helpful.

Infographics for the higher levels of contributions and rewards included images, but simple icons for bumper stickers and coffee mugs would make the first list easier to understand.

Infographics have helped make the campaign a huge success, and also made it easier for people to share through social media.


 Randy
Randy


