About
Randy Krum
President of InfoNewt.
Data Visualization and Infographic Design

Infographic Design

Infographics Design | Presentations
Consulting | Data Visualizations

DFW DataViz Meetup

Join the DFW Data Visualization and Infographics Meetup Group if you're in the Dallas/Fort Worth area!

Search the Cool Infographics site

Custom Search

Subscriptions:


Feedburner

The Cool Infographics® Gallery:

How to add the
Cool Infographics button to your:

Cool Infographics iOS icon

- iPhone
- iPad
- iPod Touch


Read on Flipboard for iPad and iPhone

Featured in the Tech & Science category

Flipboard icon

Twitter Feed
From the Bookstore

Caffeine Poster

The Caffeine Poster infographic

Entries in gun (3)

Monday
Nov032014

Filmography Print Series Posters

 Filmography Print Series Posters infographics

The Filmography Print Series was created by Cathryn and are all available for purchase at Calm The Ham. The Filmography of Guns (above), the Filmography of Cars, and the Filmography of Aircraft show a collection of popular icons from film and TV shows. Also available are book versions of the prints.

My name is Cathryn, and I’ve created the Filmography print series. Through the illustration of iconic items from film and television I wanted to create artwork for fans of popular culture, like myself. 


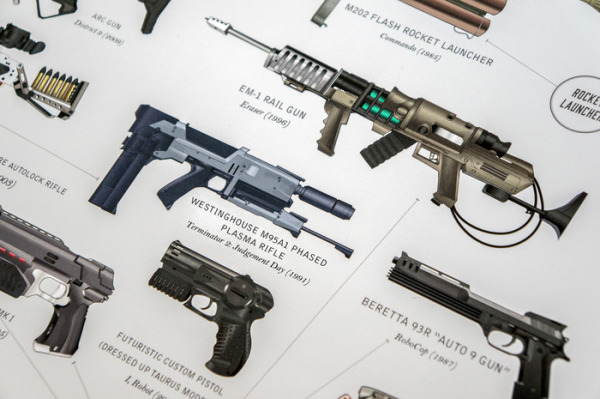
Each gun was sketched by hand with meticulous attention to every detail. It was then converted to a digital illustration. By drawing each gun at a large size (approx 12” x 18”) the detail of the weapon remains crisp when reduced in scale on the print.


The Filmography of Cars which illustrates popular cars from TV and film.


The Filmography of Aircraft, which illustrates 100 years of aviation in film.


Congratulation to Cathryn for her most recent project being funded on Kickstarter!

Tuesday
Jan082008

One Year in Iraq


New infographic from nytimes.com depicting the 2,592 deaths in Iraq over the course of the entire year of 2007. The graphic is credited to Alicia Cheng, a graphic designer at mgmt. design in Brooklyn.

The chart below — compiled from data provided by the American and Iraqi governments and news media organizations (the independent Coalition Casualty Count in particular) — gives information on the type and location of each attack responsible for the 2,592 recorded deaths among American and other coalition troops, Iraqi security forces and members of the peshmerga militias controlled by the Kurdish government.

I think this is an improvement over the "31 Days in Iraq" graphic because the new graphic identifies every death as a separate figure instead of grouping some together. There are also some differences in data, as the new graph doesn't include the Iraqi civilian deaths. So the "31 Days in Iraq" graphic showed over 1,900 deaths in January 2007, this new graphic only shows 163 deaths in January.
And, sadly, civilian fatalities in Iraq last year were simply too numerous to represent on a single newspaper page.

I'll keep an eye out in early February to see if they publish one for the month of January as they have the last couple of years.

Tuesday
Aug142007

How to Spot a Handgun


Found on Edward Tufte's website. Edward posted a small collection of infographics from Megan Jaegerman during her time working for the NY Times. This graphic of Spotting a Hidden Handgun, was updated and revised for Edward's book, Beautiful Evidence.

Megan Jaegerman produced some of the best news graphics ever while working at The New York Times from 1990 to 1998.
-Edward Tufte, July 2007