About
Randy Krum
President of InfoNewt.
Data Visualization and Infographic Design

Infographic Design

Infographics Design | Presentations
Consulting | Data Visualizations

DFW DataViz Meetup

Join the DFW Data Visualization and Infographics Meetup Group if you're in the Dallas/Fort Worth area!

Search the Cool Infographics site

Custom Search

Subscriptions:


Feedburner

The Cool Infographics® Gallery:

How to add the
Cool Infographics button to your:

Cool Infographics iOS icon

- iPhone
- iPad
- iPod Touch


Read on Flipboard for iPad and iPhone

Featured in the Tech & Science category

Flipboard icon

Twitter Feed
From the Bookstore

Caffeine Poster

The Caffeine Poster infographic

Entries in infographics (33)

Wednesday
Oct022013

40% Discount on Cool Infographics Book Pre-Orders

40% Discount on Cool Infographics Book Pre-Orders

As a special offer for readers of the Cool Infographics blog, Wiley is offering a 40% discount when you pre-order the print version of Cool Infographics directly from their site.  The list price for my book is $39.99 in the United States (CDN $47.99 in Canada, £26.99 or €32.00 in Europe), so the discount brings the price down in the U.S. to $23.99 for pre-orders.  This offer is available globally from the countries included on the Wiley site.

Discount: 40% off list price

Link: http://www.wiley.com/WileyCDA/WileyTitle/productCd-1118582306.html

Discount Code: CINFO

Expires: 10/31/13

The 40% off pre-order discount is available for the month of October, leading up to the official release on October 28, 2013.

This discount is only available for orders of the print version of the book from the Wiley site.  The prices from online book retailers Amazon or Barnes & Noble change daily (or more frequently) based on their pricing algorithms, so there’s no telling what their prices will be on any given day.  That’s why the discount is only available from Wiley.  Enter the discount code “CINFO” at checkout.

Please share this offer with any friends or co-workers that would enjoy the book!

Note: Contact me for additional discounts on bulk orders for 26 or more copies for your organization.

Saturday
Sep282013

Gone To Press!

It’s out of my hands!

This week, my project editor at Wiley told me that Cool Infographics the book has officially “gone to press!”  That means that all of the electronic layout files have been sent to the printer, and the book is in the printing schedule.  The official release date is October 28th, from online book retailers and should even include your local bookstore!

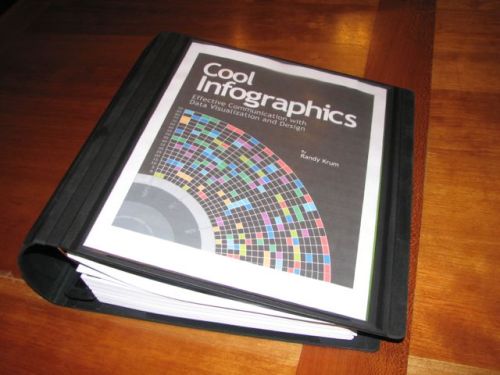
Over the last 12 months I’ve been gathering all of the materials together into the binder you see above, but I’m super excited to see the complete printed book.  I can’t wait to see the printed copy and share it with everyone.  You’ll love the full-color infographics and data visualization examples included.  The final book will be close to 380 pages!

Intended for everyone, not just designers, the book explains how to utilize infographics effectively as part of a content marketing strategy.  Things like how to structure your information flow, how to choose a topic, how to be credible to your audience, and how to publish and promote your final infographic design.  Just like this site, the book includes visual examples from designers and companies all over the world.  I designed a bunch of custom data visualizations for the book, but most of the examples are some of the coolest infographics from the web.

You can find out more about the book on the dedicated landing page I setup here: coolinfographics.com/book

To receive the book as fast as possible, pre-order your copy today from Amazon, Barnes & Noble or directly from Wiley!


Monday
Sep162013

Introducing Cool Infographics, the book

Introducing Cool Infographics, the book


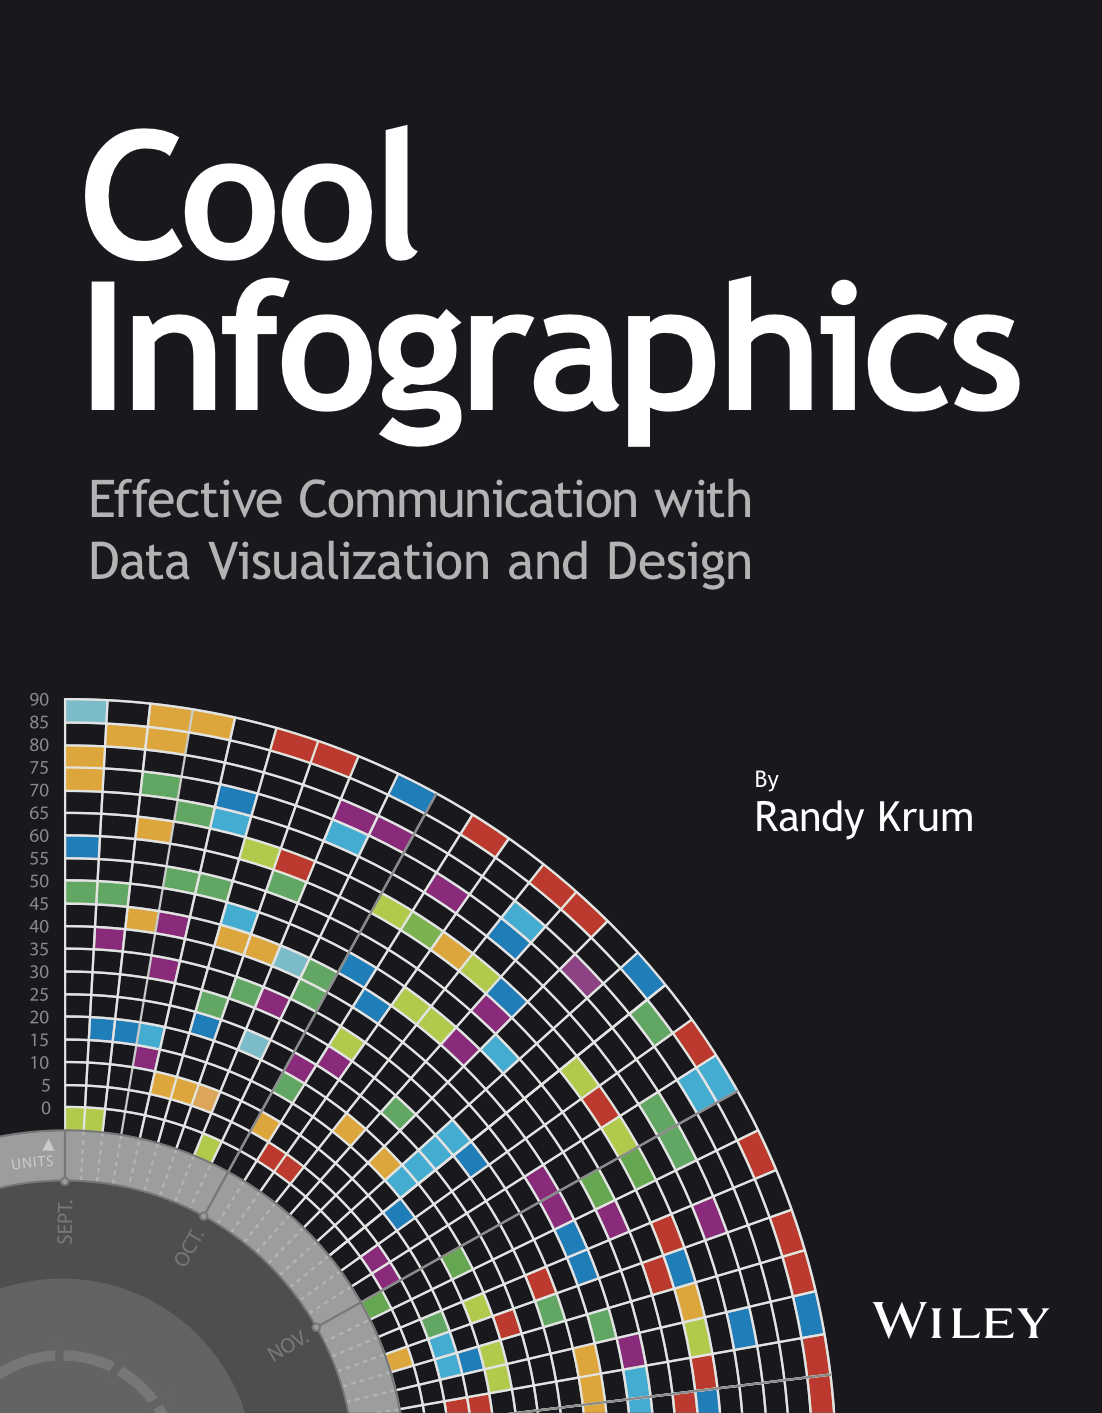
Today I’m excited to introduce my new book, Cool Infographics: Effective Communication with Data Visualization and Design!  This project has taken up an enormous portion of my time over the last 12 months and will be available at the end of October 2013 from all major booksellers (print and ebook).

This book is written for anyone that wants to learn how to use infographics and data visualizations more effectively.  Whether you design your own or work with a designer, the tactics and tips included will help you create better infographics and effectively publish them online.  Using over 100 visual examples from designers all over the world, I explain how companies are successfully using infographics every day.  It is an accumulation of knowledge and experience from designing infographics and running the Cool Infographics blog over the last seven years.

Seven major areas are covered in depth:

  • The Science of Infographics: Why do infographics work?  Humans are visual creatures.  Any information that we can communicate visually will get more attention, is easier to understand and is more likely to be remembered.  Infographics tell stories with data using a combination of data visualizations, images, illustrations and text.  Used effectively, infographics can be one of the most powerful forms of communication.
  • Online Infographics: The use of infographics online has grown exponentially in the last few years.  Why are infographics so popular as online content and how are infographics being used successfully by companies?  Are you trying to build your brand equity, drive traffic to your website or explain product features to your customers?  Different goals require different types of infographics, so make sure you know how to plan your infographics for success.
  • Infographics and SEO: Why do some infographic go viral and others flop?  Infographics and Search Engine Optimization (SEO) go hand in hand, but you have put some effort into releasing an infographic.  Issues like keywords, embed code, online lifespan, meta data and landing pages all have an impact on the success of your infographic online.  A complete infographic release strategy is outlined that covers the entire process from releasing the infographic to getting posts and links from other sites.
  • Infographic Resumes: The use of data visualization design to improve job candidate resumes is still new, but is growing rapidly.  Good infographic resumes combine the best practices from traditional resume design and viral online infographics.  Learn to design a cool infographic resume of your own.
  • Internal Confidential Infographics: There’s a secret world of data visualizations and infographics being used inside companies using confidential data.  Unlike online infographics, these internal designs are often included in presentations or shared as printed handouts.  Take the best parts of online infographics, and adapt them for your own use in presentations.
  • Designing Infographics:  Will your infographic pass the 5-second rule?  This chapter will help you design great infographics with clear data visualizations, transparent data sources and engaging topics.  We look at some best design practices as well as some common mistakes to avoid. 
  • Design Resources: Ready to get started?  Designing infographics is a combination of visualizing data, creating custom illustrations, editing images and putting together the complete design.  I’ve gathered together the major tools used by infographic designers to help you find the right software for your project.  I’ve even included a number of sources for finding data and websites that can be used to design complete infographics.

Pre-order now to get your copy as soon as it’s released!

Page 1 ... 1 2 3 4