About
Randy Krum
President of InfoNewt.
Data Visualization and Infographic Design

Infographic Design

Infographics Design | Presentations
Consulting | Data Visualizations

DFW DataViz Meetup

Join the DFW Data Visualization and Infographics Meetup Group if you're in the Dallas/Fort Worth area!

Search the Cool Infographics site

Custom Search

Subscriptions:


Feedburner

The Cool Infographics® Gallery:

How to add the
Cool Infographics button to your:

Cool Infographics iOS icon

- iPhone
- iPad
- iPod Touch


Read on Flipboard for iPad and iPhone

Featured in the Tech & Science category

Flipboard icon

Twitter Feed
From the Bookstore

Caffeine Poster

The Caffeine Poster infographic

Entries in infomation (2)

Friday
Mar162018

Where Constituent Input Ends Up


Where Constituent Input Ends Up infographic


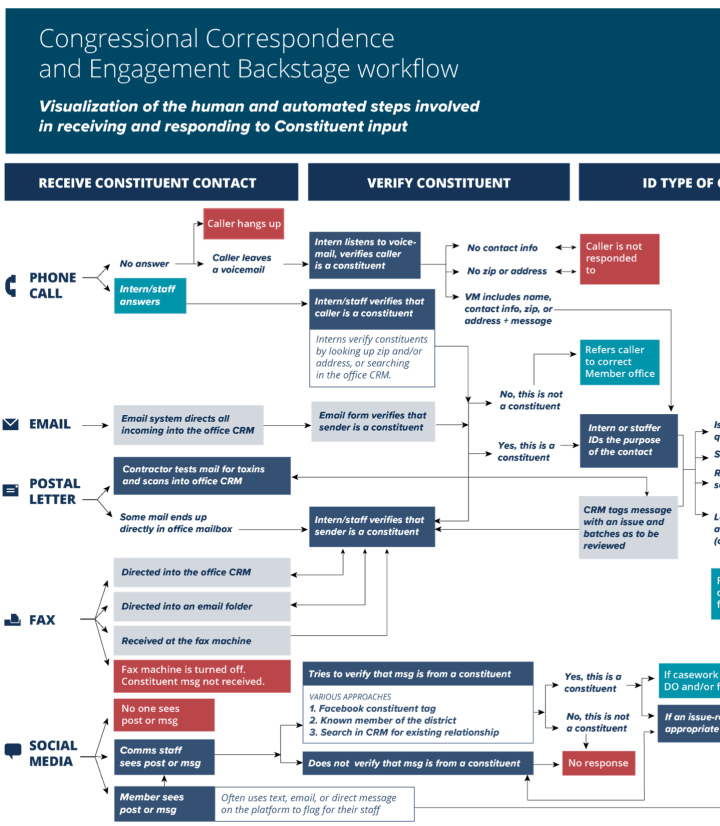
Have you ever tried to reach out to Congress? There are multiple ways to contact them, but with the high volume of constituent input, there has to be a way to filter it. Where Constituent Input Ends Up flowchart from Flowing Data tells the story of how they organize and reply to the input they recieve. 


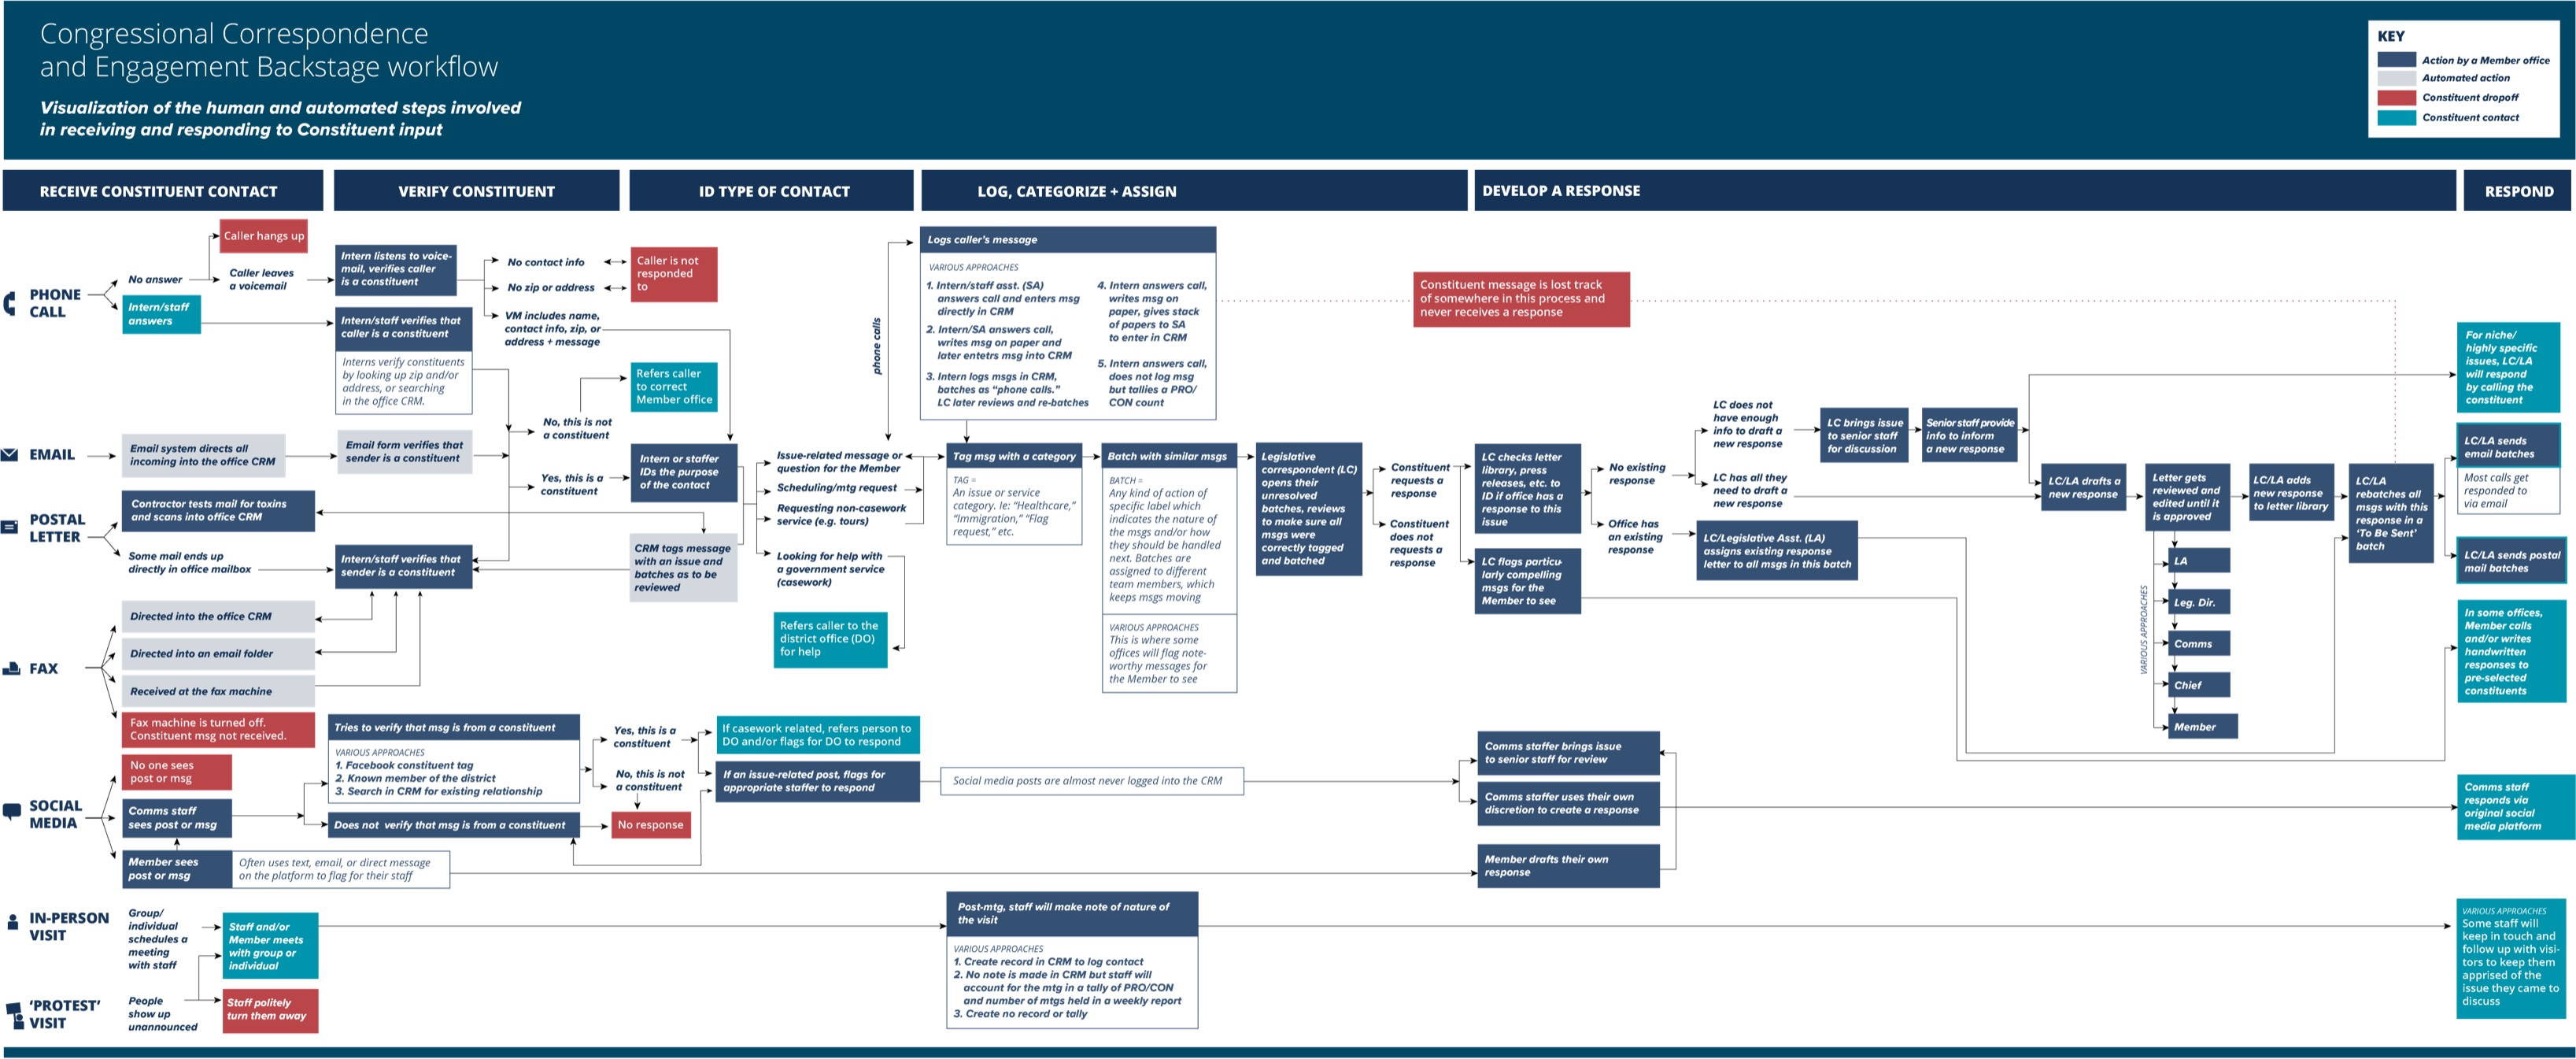
When you have input to send Congress, you have a number of communication options available to you: phone, email, social media, etc. Many of the bigger issues have dedicated sites that help automate some of the process, which of course leads to a large volume of input that lands in a congressperson’s voicemail, inbox, and notifications tab. Where does it all go?

The OpenGov Foundation looked into it and produced the From Voicemails to Votes report. The flowchart above is part of the report. Full version here.


Found on Flowingdata.com/

Monday
Aug312015

What Exactly Is The "Internet of Things"?

What Exactly Is The "Internet of Things"? is a good infographic primer of the coming storm we call the IoT. Designed in partnership by both Postscapes and Harbor Research.

Over the last several years, stories of the technologies making up an Internet of Things have started to slip into public consciousness. As this is occurring, we believe the whole story of Smart Systems and the Internet of Things is not being told. Many of the dispatches coming in from the “front lines” of technology innovation are but fragments of a much larger narrative.

From our perspective, this story is not just about people communicating with people or machines communicating with machines. Smart, connected systems are a technological and economic phenomenon of unprecedented scale, encompassing potentially billions if not trillions of nodes -- an Internet of infinite interactions and values...

A couple suggestions for the infographic:

  • Include the URL of the infographic landing page in the infographic itself (usually in the footer) so readers can find the original, full-size version
  • The landing page include a Creative Common license statement, but that should be included in the infographic itself.

A high-resolution version is also available as a PDF download or broken aparts as a Slideshare presentaiton.